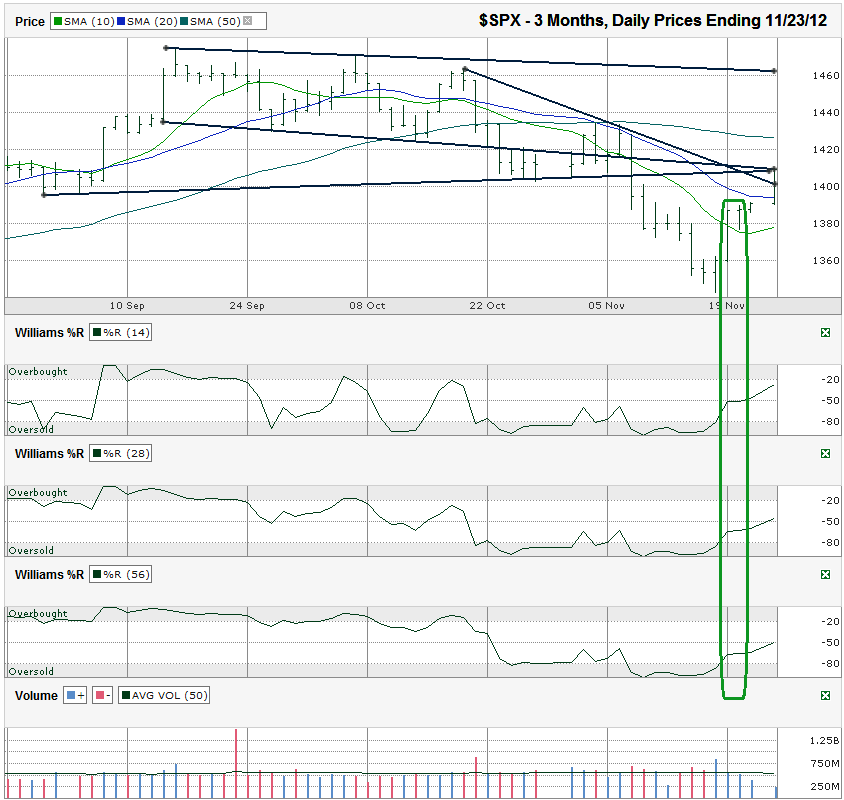
This S&P 500 ($SPX) chart shows the past 3 months of daily prices after the index finished the week at 1,409.15 on Friday, November 23, 2012.
The SPX closed above its 20 day moving average (dma) for the first time in more than a month. It moved above the 10 dma to open the week. However, one week does not make a trusted reversal. It does make us pay attention. The first key to watch is if the SPX can stay above its 10 dma. I take holiday gains with a grain of salt, but the fact remains that if you sold at the top, the profits count, so they can’t be ignored. The 50 dma is another 17-18 points above Friday’s close. That could be the next target/hurdle for traders to watch.I stepped away from the computer on Friday to spend the day with family, but wasn’t expecting much. According to the Stock Trader’s Almanac, the Friday after Thanksgiving typically favors the bulls and the Monday after that (tomorrow) favors the bears. It doesn’t go that way every year, but it’s usually not a big swing in the opposite direction. Friday’s run moved higher than expected, but without politicians around to mess it up the move went unblocked on very light volume. Why wouldn’t it? Consumer confidence is up. Congress is pretending to be nice. We’ve seen a good sell-off already. The market was ripe for a bounce, right? But where does it go from here?
Before traders get ahead of themselves, the index faces potential trend line resistance at Friday’s closing level. The bulls past the first test with flying colors as they pushed the SPX past the shortest trend line of lower highs, but they ran out of steam just a few points past that. Two trend lines converged at Friday’s close. One marks the previous support from slightly higher lows. The other was support from lower lows. As I’ve mentioned other times, what was once support often becomes resistance and vice-versa. These trend lines will cross over each other this week and traders will be able to see which side works or if the large cap index just powers through and continues the young rally.
The Williams %R indicator shows a strong change in sentiment and favors the bulls. It shows a bullish signal in the 14, 28 and 56 day periods going back to the beginning of this past week. A regular post-Thanksgiving Monday dip could be a healthy step back before the march higher continues, but it could still be dangerous to jump in head first yet. One bad comment from Congress and the negativity will return to stocks. Waiting too long to join the bulls could leave investors wishing they had taken a chance. The safer play is to sell out of the money puts and/or use a trailing stop with long positions to limit losses. If the rally continues, we could see a 1,460 print well before the end of the year as greed overtakes downside fear.


Nice chart. I could be wrong, but I am looking for a top to come in mid week around 1409-1412 which comes in well with your lower trendline. Then I will be looking for one more low in the low 1300s, and then a pretty good rally.
While my portfolio and I appreciate the rally, I expect the upward trend will be short lived. Congress was off last week and are back in town this week. Once the brinkmanship begins, the market should respond accordingly by resuming its decline 🙁
@ Emini, You were close to calling it exactly. We saw SPX hit 1419 ystdy (11/29) and that might be the high for a while.
@ SS, I agree, Congress will screw this up before anything real happens. We all know nothing will happen until the end (or soon after) at best. That’s lots of time to panic. Interesting though, I see a bunch of 10/20 bullish crossovers coming up at the same time trend line resistance is coming back into play. Next week should be exciting.