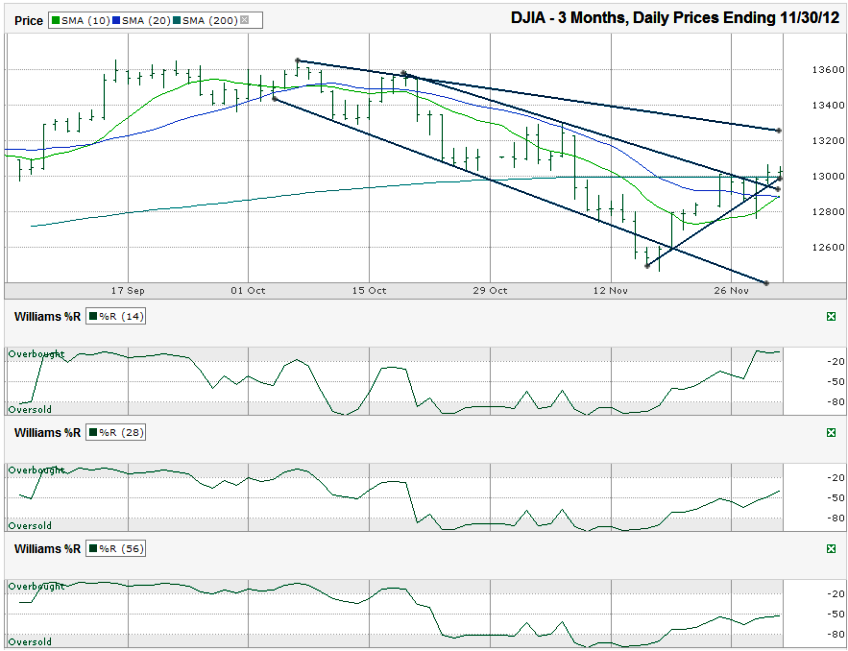
I charted the daily prices for the past three months on the Dow Jones Industrial Average ($DJIA, $INDU, $DJI, the Dow) after the index closed at 13,025.58 on Friday, November 30, 2012.
Most of you know that moving average crossovers are near the top of my list for favorite technical indicators. The rally over the past couple of weeks has set up the 10 day moving average (dma) to crossover the 20 dma. Just as this reverse crossover happened at the beginning of this little correction, this new crossover could be a sign of much stronger days to come. The 200 dma was in the way, but the Dow has been able to close above it for the past two days. Another confirmation day, especially if it doesn’t dip below the line intraday, would give this rally a lot more stability.If it wasn’t for the politicians finger-pointing competition going on, I’d be more excited about this chart. It’s loaded with positive indicators, but it just seems like one bad comment away from dropping another 4-5%. Still, it’s hard not to be invested when the technicals start lining up for the bulls.
The 200 dma acted as resistance for the four days leading up to Thursday, but so did the trend line of lower highs. Breaking through this resistance was crucial and the timing of the positive moving average signals just gives the move more credibility. I drew a short trend line of higher lows and left out the two extreme lows to show the consistency of this steady climb for the industrials. This trend line isn’t do or die, but will be good to watch for any breaks that last more than one day. The next trend line that’s more important comes from October’s intraday highs. It’s descending and is still about 200 points above Friday’s close. Watch for some short-term resistance there and maybe even a worthwhile resurgence for the bears. If the rally lasts past that, 13,400 and then 13,600 will be the next targets.
The Williams %R indicator gave the green light two weeks ago and hasn’t looked back for more than a day or two. Since it hasn’t reached overbought levels again yet, it’s not too likely any near-term drop will be too steep.
Even though the Dow pulled above its tightest trading channel, it’s still within the broader descending channel. Once sentiment shifts to “risk-off” again, bears could drag the index another 600 points lower to the trend line of lower lows. Depending on the fiscal cliff rumors (heaven forbid we actually get facts) at the time, support should kick in around there. Insurance (puts) is cheap right now from the low volatility factor. Doing some hedging wouldn’t be the worst move in this market right now.

