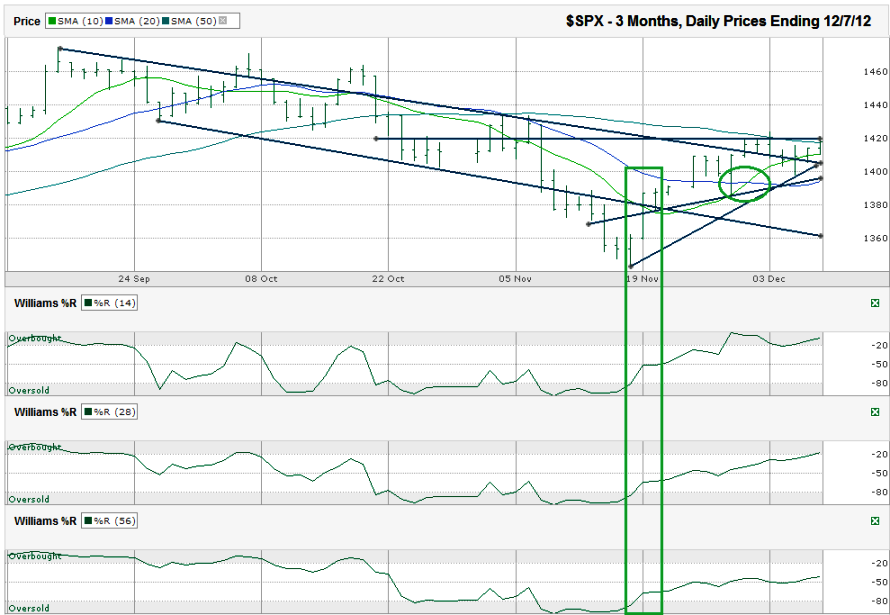
This S&P 500 ($SPX) chart shows the past 3 months of daily prices after the index finished the week at 1,418.07 on Friday, December 7, 2012.
However, prices have been rising (outside of AAPL and a few others). The SPX chart shows that the Williams %R indicator gave the green light in the second half of November. The 10 day moving average (dma) moved above the 20 dma at the end of November. The longer trend line of lower highs broke resistance and has had multiple confirmation days above it.Aside from the pesky fiscal cliff, what’s not to like about stocks right now? If the fiscal cliff wasn’t looming, I don’t see a lot of reasons for the market to be priced as it is today. Once the cliff is resolved, assuming the solution isn’t just stupid (and that might be a big assumption), the market multiple should expand and even without earnings growth, stock prices should rise. The risk of a near-term sizable sell-off is a worthwhile worry. Maybe if we wait, just a few weeks, we can buy in 5-10% cheaper. That’s the theory at least and one of the reasons volume has been so low recently.
Of course, it’s not as easy as this. The 50 dma has held resistance for a while. The S&P 500 closed above it on Friday, but only by a hair and needs confirmation days above it to make it more believable. In addition, the 1,420 line has been a hard line for the index to overcome. I’d like to see a couple of days above it, without an intraday crossover below it before I’m truly comfortable. After that, I’ll be even more bullish. It is December and stocks tend to go up in December historically. If/when that goes wrong, a 4+% correction could quickly take the SPX back towards 1,360. If that holds, it’ll be time to load up on equities and enjoy the ride back up and most likely through previous resistance.


Most of the gain came during the week Congress was off for Thanksgiving. Maybe the market is better off without them 🙂