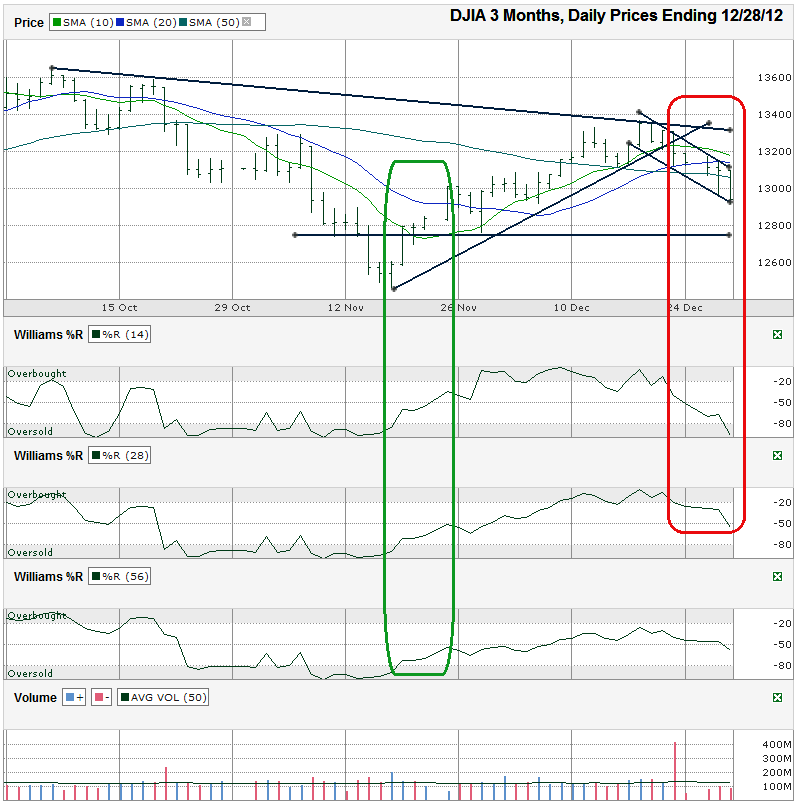
I charted the daily prices for the past three months on the Dow Jones Industrial Average ($DJIA, $INDU, $DJI, the Dow) after the index closed at 12,938.11 on Friday, December 28, 2012.
The trick is waiting for that swing to happen. Every day the fiscal cliff goes unresolved (tomorrow night is the deadline), the deeper the market will fall. The consensus says it’ll be resolved soon after the New Year begins. How soon is up for debate. By waiting for the news, rather than buying in advance, investors will miss buying at the absolute bottom, but will have the opportunity to save some “dry powder” for the reversal, albeit probably after missing the first 1-2% pop. That’s a small price to pay for wealth preservation.Fundamental data has mattered little lately. The rumors around the fiscal cliff are what drive the market these days. Technical analysis still works, no matter what is driving the price changes. The 10 day moving average (dma) held support during the most recent leg of the rally, from mid-November through mid-December. When it broke and the Williams %R indicator fell below the overbought range, technical traders knew it was time to ease up on bullish trades. Just a few days later, the Dow fell below its 20 dma and then 50 dma. The 10 dma is close to a bearish crossover below the 20 dma and would normally indicate a time to go bearish, but we’ve all seen how the markets react on any chance of a resolution to the cliff. Going short now is dangerous. Hedging long positions is smarter. Things could get ugly really soon and the chart says it, but beyond the chart are Washington D.C. and a potentially massive bullish swing.
Some talking heads think the fiscal cliff resolution could be a “sell on the news” event. To avoid that potential fall, risk-averse traders might wait for a full confirmation day or two before buying in. That could mean missing 3-4% of upside for the safer trade. Williams %R will be quick to show the momentum. Keep an eye on the 14 day indicator for the earliest clues. If the cliff talks drag on, watch the 12,750 area for potential support and then around 12,471 (November’s low). Nibbling in around there could be good entry point if you have a lot in cash available. The upside could be capped temporarily around 13,300 where the longer trend line of higher lows comes back into play. The nearest-term upside resistance looks to be each day’s previous high. For more than a week, the DJIA hasn’t bested its prior intraday high. A change in this trend could be the earliest indicator sentiment is changing.
Trade carefully and be ready for a profitable 2013. Happy New Year!

