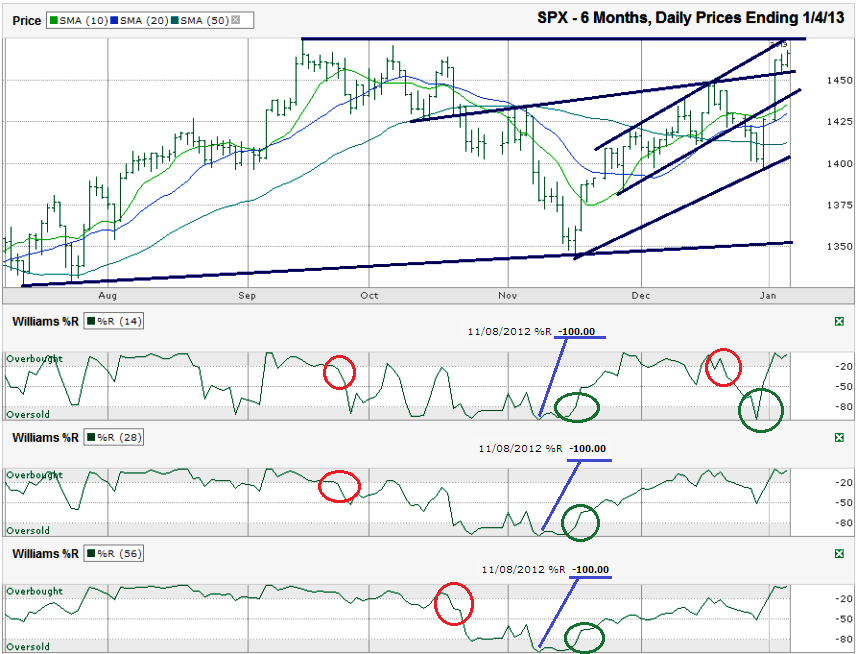
This S&P 500 ($SPX) chart shows the past six months of daily prices after the index finished the week at 1,466.47 on Friday, January 4, 2013.
By the time stock futures first printed on January 2nd, all investors could see the “risk-on” trade was back. The moving averages were no longer going to be weighted down by sinking prices and the large cap index was clearly moving back into its previous trading channel. That was the easy trade. The question is where will stocks go from here?The past week lived up to the hype built around a possible resolution to the fiscal cliff and surged higher. In the prior week, the S&P 500 index fell below its recent trend line of higher lows and below multiple moving averages also. In addition, the Williams %R indicator fell below the overbought area. These are typical technical indicators that cause technicians to sell, but a good investor understands charts should not be viewed in a vacuum. The deadline for the fiscal cliff was weighing on sentiment and while removing some risk and hedging was a wise set-up going into the final days, shorting the market would have been far too risky due to the upside risk.
As this chart shows, the beginning and end of large trends are marked by shifts in the Williams %R indicator. This indicator does not foreshadow trend changes, it highlights when they have begun. The most recent indications show the bull market is still in play. While the shortest two periods below shows a signal change last week, the longest period has stayed bullish for nearly two months already. The rally is likely to continue until all three fall below overbought again. In rare occasions, Williams %R does foreshadow directional shifts. Note the extreme low in all three periods on November 8th. This tends to predict a bottom is due within two to four days. The SPX took six more days this time, but traders would’ve done well to start buying in on the fourth day.
For a precursor to a signal from Williams %R, traders watch the moving averages and trend lines. Resistance could surface at the recent market top from September, close to 1,475. A breakthrough above 1,475 could mean another 5% higher in a very short time. If this resistance holds, traders need to consider what the downside risks are. This resistance is close to lining up with the shortest trend line of higher highs. Resistance here does not mean the rally is over; it’s simply a reasonable level for a consolidation after such hefty gains.
Any downside will first be limited around 1,455 at the trend line that cuts through the middle since October. It has worked as both support and resistance on multiple occasions, as recently as Thursday. If it breaks, each trend line of higher lows could offer support, from 1,450 and 1,410 down to 1,352. If the first of these three trend lines breaks support, the moving averages will have to fail before the next one comes back into play. If the SPX falls below 1,400 before the end of February, stocks will not be likely to withstand the second technical break in as many months. 1,350 will be the next target as shorter moving averages fall below the longer ones. By that point, value investors will begin to resurface and traders will eagerly accept downside risk again as the SPX becomes too cheap relative to the upside risk.


