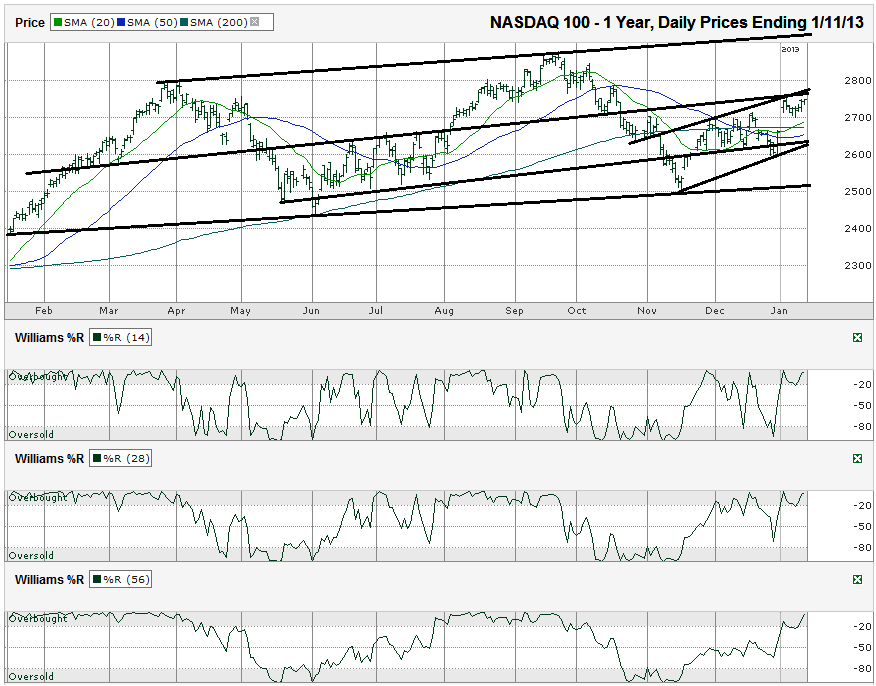
This NASDAQ 100 ($NDX) chart shows the past year of daily prices after the index finished the week at 2,748.26 on Friday, January 11, 2013.
However, a drop that much would push the tech-heavy index below its 20 and 50 day moving averages (dma). The 200 dma would be challenged and would have to be the extra point of support needed. The Williams %R indicator is already in bullish territory, so there’s no new trigger for now. The key will be to see when this changes direction. A 3.5% mini-correction probably wouldn’t cause the 56 day indicator to issue a sell signal, but could make the 14 day indicator show the change in sentiment.This chart is interesting. The NDX (for ETF tracking, see QQQ) is barely above the middle of its longer trading channel, but is at the top of its shorter-term trading channel. That could mean a near-term dip could be due that should be considered a great buying opportunity. A drop to around 2,650 (~3.5% lower) would shake out some fearful investors and free up some more upside potential while staying above two trend lines of higher lows.
2,500 looks like a solid floor and if the NDX get that low (about 9% below Friday’s close), investors should quickly convert to bulls to catch the mammoth rally from there. The downside risk from 2,500 is limited and the upside potential would be huge. From Friday’s close, the upside and downside risk is almost even. Selling puts out of the money looks like a better trade than buying calls at this point. Worst case, the NDX dips and the put seller buys in at a better price for a longer-term position. Worst case, the put seller makes a profit on the put and reduces risk in the meantime.

