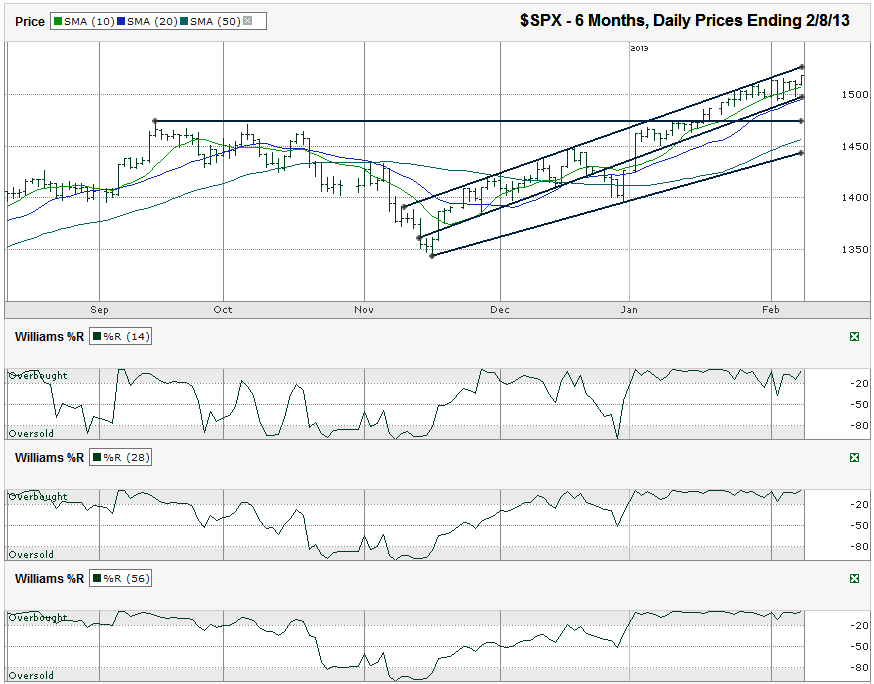
I charted the monthly prices for the past 10 years on the S&P 500 ($SPX) after the index closed at 1,517.93 on Friday, February 8, 2013.
The S&P 500 threw out some red flags this past week with three moves below its 10-day moving average (dma). However, only the first move below the short-term moving average resulted in a close below it. Each of the other days finished with a recovery. That still gives a technician reason for pause. Often, but not always, weaker days are coming when an index or stock stocks flirting with its closest moving average. This gives the longer-term moving averages time to “catch-up” and can result in a crossover of the shorter-term moving averages below the longer-term moving averages. For now, this is just a warning. The crossover hasn’t occurred yet and the SPX is still moving above its 10 dma. It’s worth watching and being more alert.
The narrow trading channel that started in November is intact. It broke at the end of January, but quickly resumed its trajectory and stable borders of support and resistance. This lower line appears to be the most crucial trend line of higher lows. It could force a technical event before the moving averages do. The 20-dma is almost in line with the trend line of higher lows. That coincidence won’t last very long. For now, it gives double support, but the lines will move apart soon, especially if the market moves sideways for more than a few days.
The upside has plenty of room to melt higher. The next area of ascending resistance moves higher each day the index moves sideways or takes a small step lower. The downside potential, after a confirmed break of the trend line mentioned above and the 20-dma, could find support around September and October’s peak levels, close to 1,470-1,475. This was also brief support and resistance in January. Depending on how long it takes for a move lower to surface, the 50-dma could catch up to this point to provide further support. Buyers will likely flood the market if/when the S&P 500 moves down 3% to these levels. Many investors have been waiting for a shallow pullback to add to their positions. 2-3% could be enough to keep the longer bullish trend running.
If the 1,470 level doesn’t hold, investors could see a very fast 20-point drop to the bottom of the SPX’s broader trading channel. This would equal close to a 4.5% drop from recent highs and should bring out the buyers who were too shy 1.5% higher. This has a high probability of being the low of 2013, if it even comes back into play. Worst case, assuming there isn’t a massive black swan event out of Europe or China, 1,400 should provide stronger support. That would be close to 8% below Friday’s close and at an area of previous support, not to mention the round ’00 number traders mingle around.


