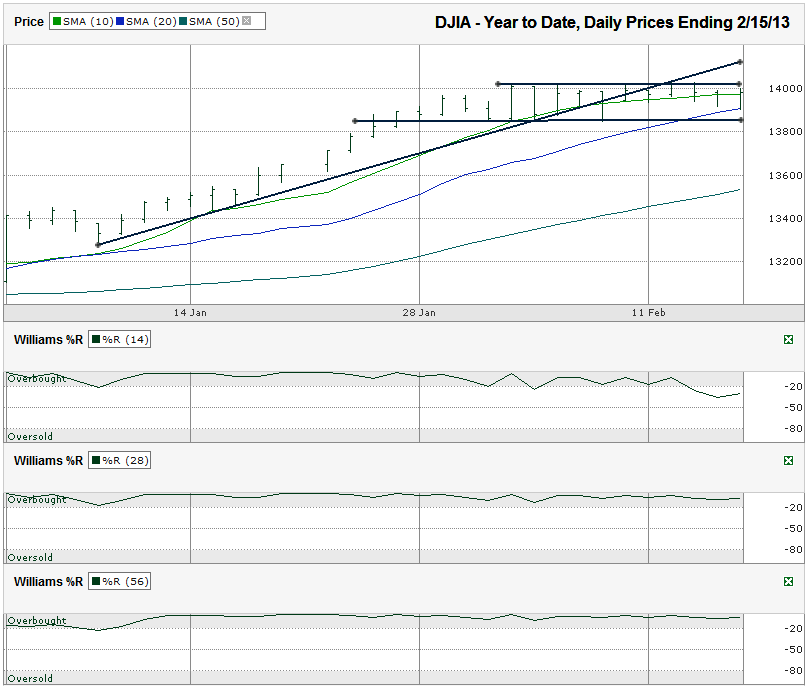
I charted the daily prices for the year to date on the Dow Jones Industrial Average ($DJIA, $INDU, $DJI, the Dow) after the index closed at 13,981.76 on Friday, February 15, 2013.
The moving averages offer some help here too. The 10-day moving average (dma) is still above the 20 dma. Traders will know to cut back on bullish positions when the 10 dma falls below the 20 dma. The fall below the 10 dma intraday over the past two weeks has been enough to cause red flags to go up. The 20 dma hasn’t given up support yet. That will have to happen before the lower end of the trading channel breaks and it could happen in the same day on any hint or rumor of bad macro-economic news.The DJIA has moved in a sideways trading channel for two weeks. This is the channel to watch. Whichever side breaks, preferably with a confirmation day or two, will be the direction the index moves for the next 4-5%. To the upside, the trend line that was support up until about a week and a half ago will likely act as resistance if the move heads higher.
In addition to the warning signal from the 10 dma, the Williams %R indicator is giving its own yellow light. The 14-day indicator already broke below overbought. This is a sign that short-term sentiment has shifted. The 28 and 56-day indicators haven’t shown that a bigger trend is in place yet. They will likely break within a day of the 20 dma losing support, if that happens within the next week or so.
If the sideways movement for the Dow continues for more than a week, it could result in a healthy consolidation period that never causes the bulls much, if any, pain. The market needed time to digest the big rally that started mid-November. Sideways trading doesn’t last for long with indexes. The catalyst for a shift is still unknown, but be ready for whatever it is. Whenever it starts, it will likely be a swift change.

