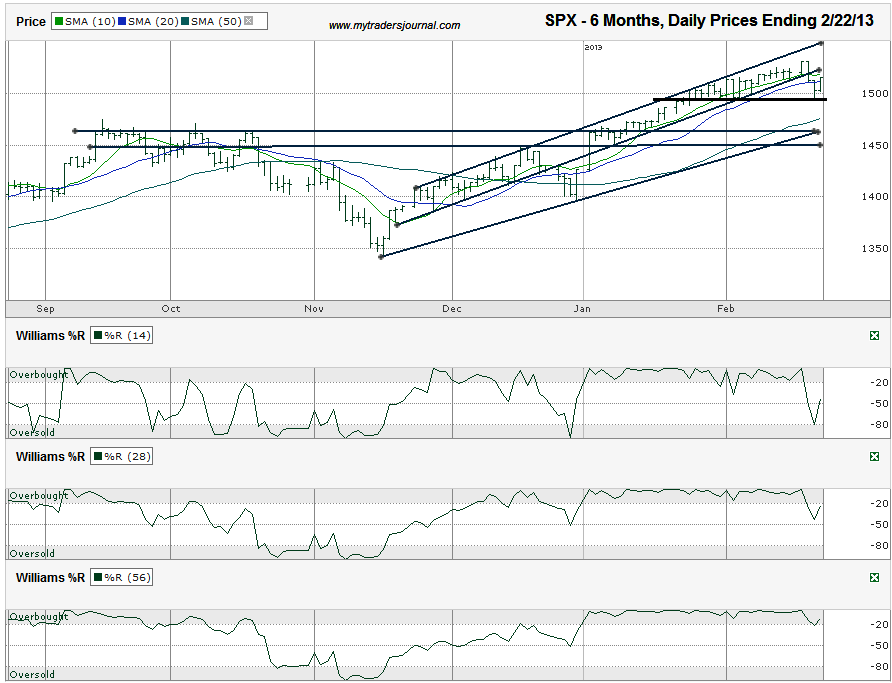
I charted the daily prices for the past six months on the S&P 500 ($SPX) after the index closed at 1,515.60 on Friday, February 22, 2013.
Last week, the S&P 500 fell below its multi-month trend line of higher lows. At the same time, it fell below its 10-day moving average (dma) and 20-dma. All three of these events are red flags, but support held just below 1,500 where buyers have resurfaced in the recent past.
The move higher on Friday morning might not have been more than a dead cat bounce. It allowed a retest of the moving averages. The 20-dma didn’t stop the upward momentum, but the 10-dma was too much for the bulls to overcome. Traders should expect the previous trend line of higher lows to act as resistance on any move higher. This trend line will likely become a trend line of higher highs. That’s a best-case scenario.
The move lower could get nasty if the SPX does not act like it did in late December. Ironically, the December dip happened just before the fiscal cliff deadline. This coming week’s sequester deadline could play out the same way with a reprieve on the final day, but stocks will pay the price if Congress doesn’t get it together.
Watch for the 10-dma to fall below the 20-dma to know a longer momentum shift has started. The Williams %R indicator added additional red flags in its 14 and 28-day periods, but started to recover before multiple confirmation days showed up. The 56-day indicator didn’t break yet. It will if the support line at Thursday’s intraday low breaks.
The large-cap index could race to test its 50-dma on such a support break. That’s also close to the longer trend line of higher lows and not far above another two areas of horizontal support. A mini-correction of close to 5% might be as big of a fall as we’ll see. If that’s the case, buying a put spread on SPY with $145 as the short side could be a good hedge. I might add that trade, or something similar, in the coming days.


