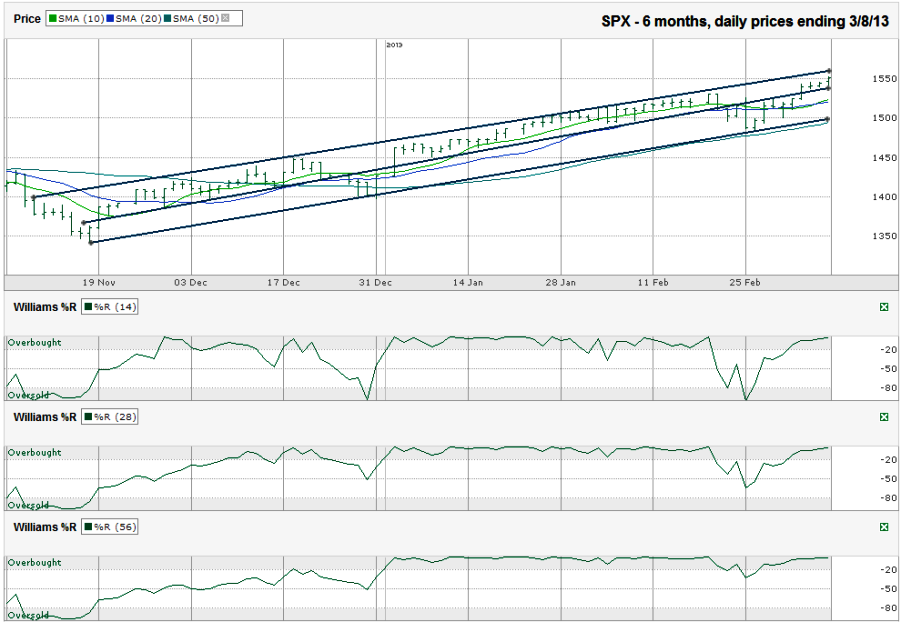
I charted the monthly prices for the past six months on the S&P 500 index ($SPX) after the index closed at 1,551.18 on Friday, March 8, 2013.
As the S&P 500 passes its fourth birthday since it bottomed on March 6th, 2009, it is approaching its all time high of 1,576.09. The large cap index doesn’t show many signs of weakening, but traders might find a better entry point by waiting. Then again, the technical indicators don’t show a reason to wait. Mondays have been trading lower every week for a while. Those have been good buying opportunities since the index has recovered from each dip. Whether it’s this week or in two or three weeks, one of those dips is going to turn into a bigger drop.
The bulls aren’t going to stop their stampede until there is a reason to sell. That doesn’t mean they can’t take a breather every now and then. That’s healthy for the market. One of those breaks in buying could happen soon. The SPX is close to the upper end of its ascending trading channel. During mid-January to mid-February that didn’t matter. It rode the line of resistance without selling-off for a few weeks straight. Finally, it sold off a little to start the process over again.
The SPX chart was setting up for a bigger correction. The Williams %R started to give one of its rare false positives, although the 56-day period never had a confirmation day. These head-fakes don’t tend to happen twice in a row, so keep an eye on this indicator because the next one could be the warning signal for a 6% correction, if not 10%. The 50-day moving average (dma) offered support before the 56-day Williams %R indicator could have a confirmation day that a real sell-off was starting. This ascending moving average is going to be key support for the rally. The bears will be ready to take over when (not if) it breaks. If the 50 dma isn’t enough, the trend line of higher lows that started with the November low helped to offer support too and is moving higher at close to the same rate as the 50 dma. Having both of these to watch will help traders know if any sell-off is going to be more than just a shaking of the trees.
In addition to the Williams %R red flags, the 10 and 20 dma started to show a bearish crossover. The moving averages showed a negative signal for four days, but they were clearly showing a more bullish outlook with the 10 dma above the 20 dma again by Thursday. Even though this was a very brief crossover, the reemergence of the 10 dma over the 20 dma is a bullish signal.
It’s important to keep your guard up (i.e. stay hedged) even with bullish signals showing on the chart. The first area of support is around 1,543. After that, 1,525 and then 1,500 will important to watch. If the S&P 500 falls below 1,500, we could see a very fast run to 1,450. 1,400 is a long shot and I don’t think the index will trade that low again any time soon. If it gets close, I’ll plan to start loading up again. The upside could face resistance at the all time high of 1,576. After that is when you could see previously scared investors starting to believe. We could see a solid sell-off again about a month after that.


