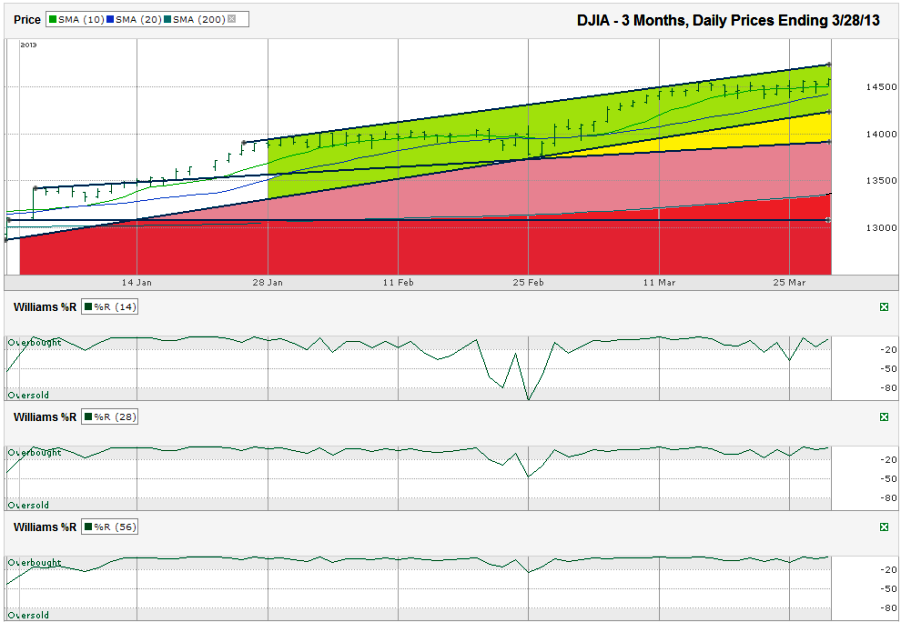
I charted the daily prices for the past three months on the Dow Jones Industrial Average ($DJIA, $INDU, $DJI, the Dow) after the index closed for the week at 14,578.54 on Thursday, March 28, 2013.
The green area shows the current trading channel locked between a trend line of higher highs and another trend line of higher lows. The DJIA has another danger, even within this trading channel. The 10-day moving average (dma) has broken support in seven of the last nine trading sessions. Each cross, even if it recovers before the close raises red flags. That’s a big pile of flags without any even happening. If nothing else, the sideways price action has given the 20-dma time to catch up to the 10-dma and we could see a bearish 10/20 crossover soon. This could be the first signal traders see before a real sell-off begins.The DJIA has nearly flat lined over the past few weeks, but managed to poke a little higher on Thursday to pull it back above where it was two weeks ago when I said it was looking overbought. I had so many trend lines and moving averages within a small space on this chart that I thought I could make my point better using colors.
That could precede or coincide with a fall into the yellow area on the chart. That’s below the first trend line of higher lows, but still above the next trend line worth watching. It touches previous resistance and previous support. A dip to this lower line would be close to 4% below Thursday’s close and should garner some support, especially with some investors who believe round numbers, like 14,000, matter. At that point, it should be a good time to start nibbling in, but if a shallow dip isn’t enough to bring in buyers from the sidelines, the DJIA could head into the pink zone.
The pink zone covers the area all of the way down to the 200-dma. Depending on how fast the DJIA falls (and expect a fast fall if the 14,000 area doesn’t hold support), this could be approximately 8% below the recent (and all time) high for the DJIA. I expect the bulls to take over the reigns at this point. The chance of a real correction going past 13,100 (~10%) is very slim from current valuations. In other words, any Dow movement in the lower portion of the pink zone will likely end up being a great buying opportunity, if it even moves that low. If we see the Dow close to the bottom horizontal line, expect to see me going long in some leveraged ETFs.
Of course, none of this is going to happen without the Williams %R indicator dropping below the overbought range and that hasn’t happened since February. Even then, the 56-day indicator didn’t give a confirmation and the 28-day indicator only fell below this range for two consecutive days with one of those ascending. It’s worth being a little jittery when the 14-day indicator shows its hand next, but for a real correction to begin, the 28 and 56-day indicators must join in.

