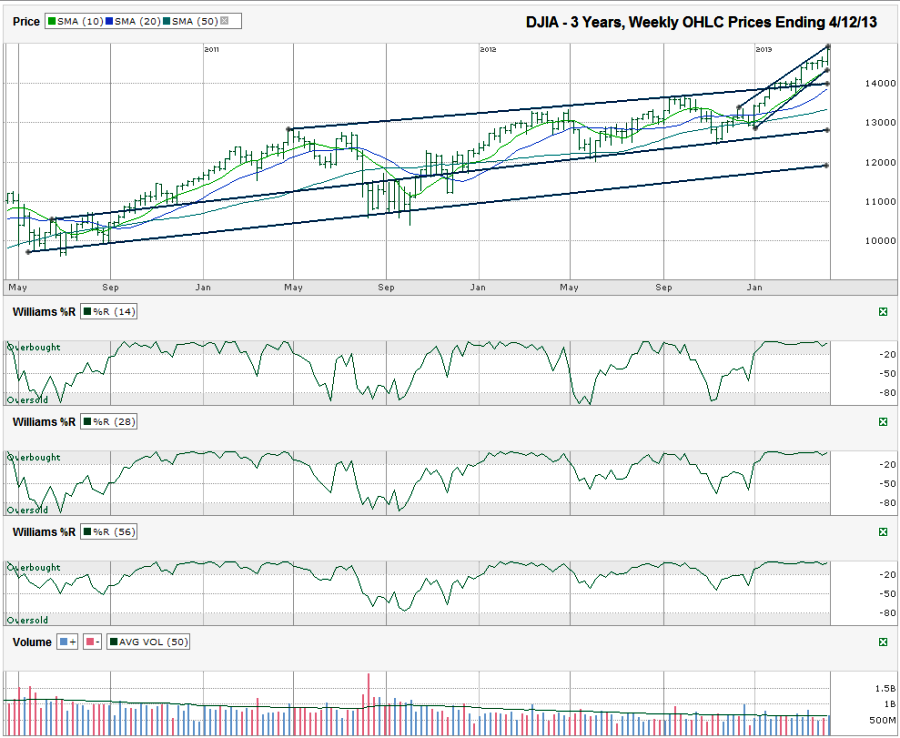
I charted the weekly prices for the past three years on the Dow Jones Industrial Average ($DJIA, $INDU, $DJI, the Dow) after the index closed for the week at 14,865.06 on Friday, April 12, 2013.
The technicals haven’t changed for the most part, but have a new twist to them now. The daily chart looks similar to two weeks ago. Williams %R recovered and the 10-day moving average (dma) stayed above the 20-dma. To get a different perspective, I switched to the 3-year, weekly prices chart. It’s fairly similar. The Williams %R indicator shows the 14, 28 and 56-week periods are all in the right order for the bulls. Volume hasn’t done more than steadily decline for most of the past three years.A couple of weeks ago and nearly 300 Dow points ago, I charted this index and pointed out it was worth being jittery, but not worth selling yet. By following the technicals and not emotions, technicians who use these indicators didn’t panic.
Trend lines might be the best indicator to use for now. Keep in mind that with longer-term charts, the short-term moves are harder to predict. This outlook is more geared for the next few weeks and months than the next few days. The longest trend line of higher lows that was acting as resistance broke a few weeks into the year. That was a major hurdle for the bulls and proved this latest leg of the rally was worth joining, especially after that line was tested for the following few weeks. This is going to be the line to watch for early support on the next decent pullback. Such a decline would be less than 6% and should be enough to appease those who have been waiting for a dip. It’s also close to the 20-week moving average for added support.
For more immediate price action, check out the year-to-date trading channel. It started in late December for the upper trend line and the beginning of January for the lower trend line. This has been a steep trading channel and such ascensions rarely last as long as this one has already. With the DJIA trading at the very top of this line, chartists can expect sideways to lower prices in the near-term. The next true test will come when the Dow tests the trend line of higher lows that coincides fairly closely with last week’s intra-week lows and the 10-week moving average.
Just as two weeks ago, there are no alarm bells going off yet from the technicals, but there is reason to be concerned about the index getting a little high into its trading channel. I expect the 14,000 area to hold around that 6% correction territory. If it doesn’t hold support, the next area of support could come from the 50-week moving average, which is another 700 points lower. Below that, the next potential strong support might not be until 12,000. That would be a 20% correction, aka a bear market. I don’t see that coming in the next few months, but it’s always possible.
Keep your wits about you and don’t panic, until the technicals agree with your emotions.

