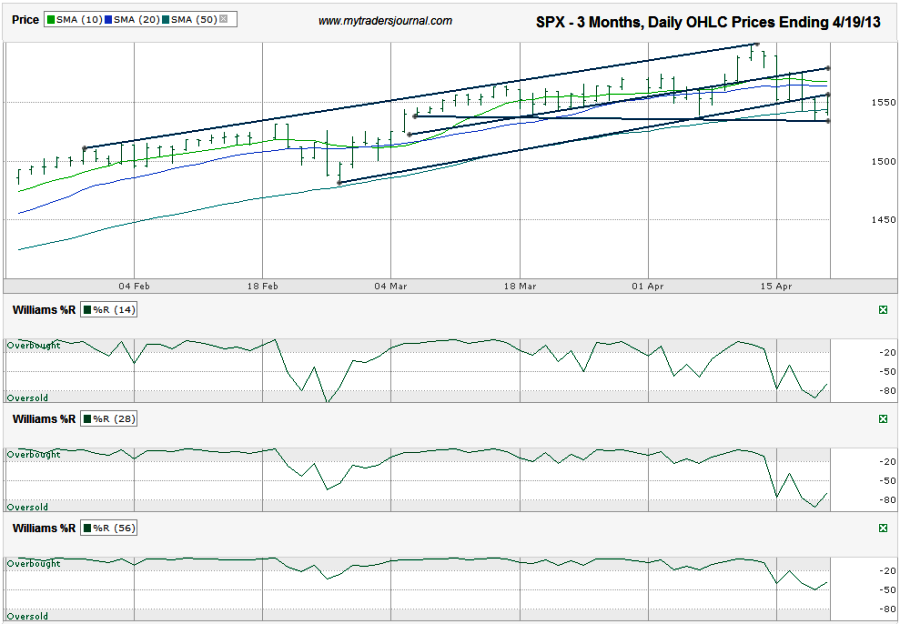
I charted the daily prices for the past six months on the S&P 500 index ($SPX) after the index closed at 1,555.25 on Friday, April 5, 2013, almost exactly where it was when I charted it two weeks ago.
The charts are easy to read sometimes and leave little doubt as to what is to come next. This chart is not one of those times. Two weeks ago, I said, “By the time the 56-day indicator [Williams %R] catches up, the SPX could be another 2-3% lower”. Wednesday’s low, which included a touch of the 50-day moving average and a break below overbought for the 56-day Williams %R indicator, was 3.35% below the recent intraday high. The next two days gave confirmation days on the Williams %R indicator, but with a catch. The 14 and 28-day indicators are already bouncing out of the oversold area. This typically foreshadows a recovery.
The trend lines start to help the story a little, but then they aren’t perfectly clear either. The three trend lines I drew that are ascending all point to the SPX moving lower in the coming days and maybe weeks. However, the single descending trend line marks the trend of lower lows where support has been seen for the past month and a half. We could see another bounce from here, but the 10 and 20-day moving averages (dma) are going to be important technical hurdles to clear before getting overly bullish.
The 10 and 20 dma are moving lower and if the SPX doesn’t move above both of these converging lines soon, the 10-dma will move below the 20-dma. That is a very bearish crossover and could indicate further weakness is coming. The last crossover only lasted a day and by the time the moving averages crossed, the index was already above both lines showing strength. These non-event crossovers rarely happen twice in a row. That means the next one should be worth selling. It won’t take more than a couple of days to see if resistance at the trend lines holds stocks down. Then again, Thursday’s 3.8% drop from the April 11th intraday high could be all the bulls needed to reset. I was looking for a full 5% and possibly up to 7% due to the length of the rally without a pause, but the SPX has been moving sideways for long enough now that the consolidation without a sell-off was enough to satiate those pondering their next purchases.
The zones between the 20-dma and the 50-dma are narrow enough that waiting for clarity won’t cost investors much on either side. Once one side breaks, expect a few more percentage points of movement in that direction. Probability might slightly favor the bears, but not by much.


