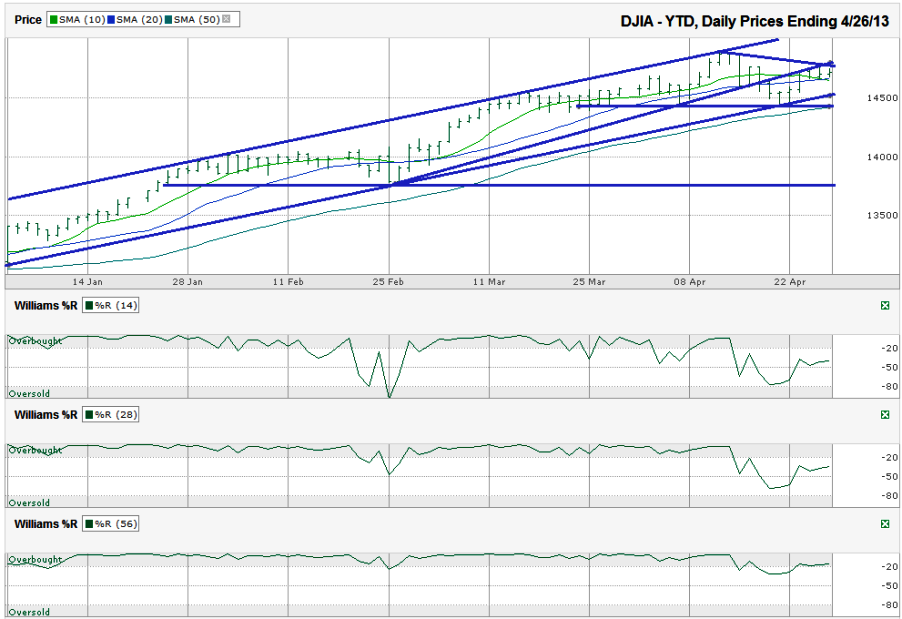
I charted the weekly prices for the year-to-date on the Dow Jones Industrial Average ($DJIA, $INDU, $DJI, the Dow) after the index closed for the week at 14,712.55 on Friday, April 26, 2013.
Chart technicians have to be careful not to draw trend lines that fit the story they want. Being objective isn’t always as easy as it seems, but it’s possible. The two trend lines of higher lows in the chart below tell two different stories. Which story will be true is still unknown. What is known is that the picture isn’t as clear going into the “spring selling season” and anyone using charts to help make investment decisions needs to understand the risks.
The market has had an extended rally this year without much of a breather. We all know that’s going to change eventually, but none of us knows when. The longer trend line of higher lows below shows support held on the recent dip. If that was the only indicator available, it’d be a clear buy signal. Since we have other indicators available, the bullish case gets watered down. The shorter trend line of higher lows broke support in mid-April and then became resistance, albeit ascending.
The bears can also point to the shortest trend line on this chart. It marks the newly formed trend line of lower highs. This is going to be a key line to watch on any moves higher. As short as it is, it could amount to nothing more than a day or two of resistance, but if the Dow continues to bump against it as it fails to move higher, expect much more weakness. Before the bears can get carried away, the horizontal trend line that started in late March will have to break. You can expect massive selling if this line breaks as the computer-based selling kicks in. That same line is running even with the 50-day moving average (dma). A break of both of these gives the bulls reason to hide.
One of my favorite signals is derived from moving averages crossing over. Theses instances often mark major sentiment shifts. The 10-dma is starting to cross below the 20-dma, but the DJIA is throwing a wrench into this usually reliable indicator. The DJIA moved back above both moving averages on Wednesday and unless the Dow falls below them again, the 10-dma will regain its position above the 20-dma and the sell signal will be avoided. If it drops below these moving averages again, it could be the start of a bigger decline for the large cap index.
The fall beyond this potential area of support could take the DJIA all of the way back to its February low, about 7.5% below the recent DJIA intraday high and 6.3% below Friday’s close. Again, none of that happens until the DJIA falls below its 10 and 20-dma again. The Williams %R indicator showed caution signals on all three of the time segments I used below. However, sentiment changed before it reached oversold on any of the views. The 56-day indicator has moved back into the overbought range. This creates a scenario where this indicator started to issue a sell signal, but didn’t have enough of a follow through to keep the bearish sentiment running. Now, like the trend lines analyzed above, the next step isn’t clear. That said, any movement lower will show the sentiment shift towards a bearish outlook is still in progress and could offer a 6%+ dose of pain for the bulls.


