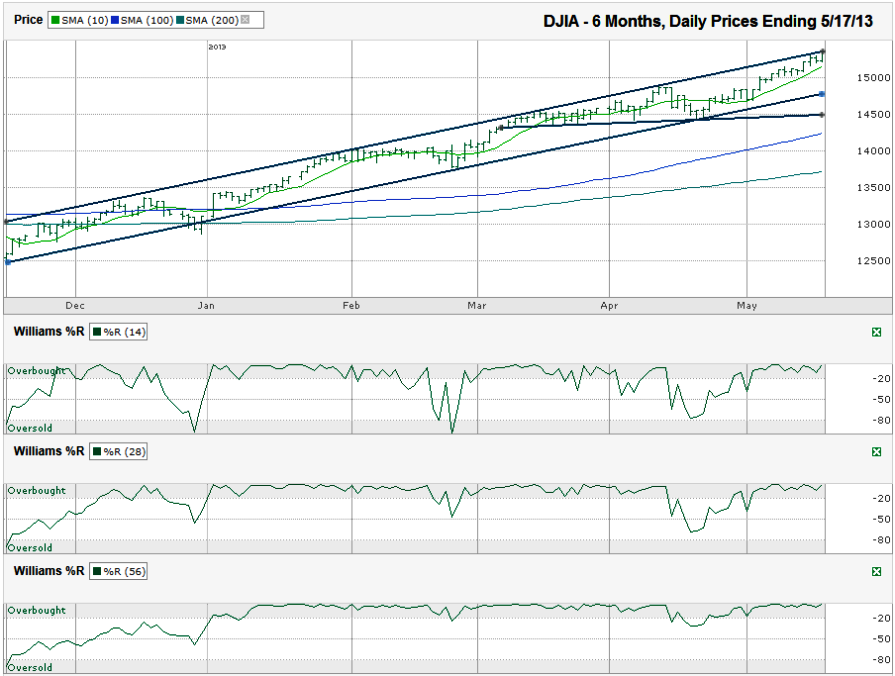
I charted the daily prices for the past six months on the Dow Jones Industrial Average ($DJIA, $INDU, $DJI, the Dow) after the index closed for the week at 15,354.40 on Friday, May 17, 2013.
Some of the reliable indicators are less predictive once a stock or index stretches past old highs. Previous resistance has been broken and no time in the past can be used as a guide to the next hurdle. The trend line of higher highs can be a small guide for where a surge might stop, but it doesn’t mean the chart is going to turn south. The past six months have shown that every touch on the upper trend line has only meant sideways movement for the next week or two with an occasional 2-3% drawdown. The DJIA can fall 3.5-4.0% and still be above its trend line of higher lows. A move down to the short trend line of higher lows, around 14,500, would be a 5.5% mini-correction and the rally could continue from there.
The moving averages might be more telling, not for when they have their next bearish crossover, but based on how stretched the index is from the bigger moving averages. Since the DJIA has pushed higher without a true consolidation phase, the space between moving averages has grown wide and a crossover might not appear until after the first 4-5% of a correction and that might be too late.
The DJIA would have to fall only 2.44% to hit its 50-day moving average (dma). The longer averages are where the extent of the rally-without-consolidation can be seen best (or is it worst). The DJIA would have to fall 7.12% to hit its 100-dma and 10.58% to hit its 200-dma. A 10+% correction is a long way to fall, just for a reversion to the mean and illustrates the point I’ve made over the past couple of months that longer it takes to correct, the bigger the correction could be.
That’s been my view for a while and the Dow has kept climbing. Therein lays the problem with begging for a correction. It’s not a prediction of when and where the market will top out. It’s more of a reminder to hedge because a correction will surface eventually and even if it’s three months from now, it could knock prices below today’s levels much faster than it rose for most stocks.
The Williams %R indicator will be one of the earliest warning signals, but just as in April, it can give a false positive on a shallow dip. Waiting for the 56-day %R indicator to show a confirmation day will be around 4-5% after the floodgates have opened. It could be worth flinching a little earlier, because that might be half of the correction. Then again, if you believe the bull market will run through next year, 5% lower might be the time to start nibbling in to build a more bullish portfolio.


