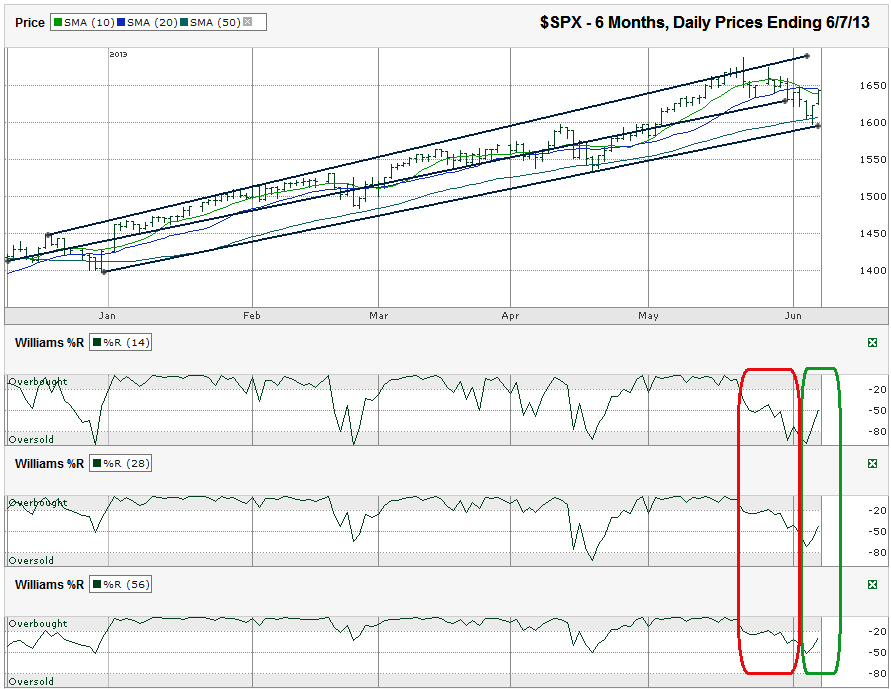
I charted the daily prices for the past six months on the S&P 500 index ($SPX) after the index closed at 1,643.38 on Friday, June 7, 2013.
After the Williams %R indicator raised red flags two weeks ago, the selling pushed the index further below its 10-day moving average (dma) and then below its 20-dma. By the time the bearish 10/20-dma crossover hit, the 50-dma came into play and provided support. The 50-dma broke support in April also and recovered quickly to allow the SPX another 100+ points higher. That run overshot the SPX over its trend line of higher lows. That was a sign of a peak and kicked off another bout of selling back down to the 50-dma again.The S&P 500 is back to where it was two weeks ago when I pointed out some rougher days were forecast. The attempt at a correction didn’t go too far, but the drawdown might not be over yet. Either way, it won’t take long to figure out the new momentum.
Since bouncing from its 50-dma, the SPX is caught below its 20-dma still. The bulls will look to the fact that it has already overtaken the 10-dma and didn’t have enough time in the day to pass the 20-dma. That might be true, but it didn’t do it yet and that’s relevant. Watch for continued resistance at the 20-dma to know if the past two days was simply a dead cat bounce. A solid two day move above the 20-dma could mean the bulls are fully back in charge and are on track to push the index to new highs, possibly over 1,700.
Any weakness still has to make it through the 50-dma for two closes to signal a severe round of selling is on tap. Such an event could send the SPX towards 1,550 or even 1,500. It’d be easier to see a strong rally on the horizon if the index had reached oversold levels on the Williams %R indicator. The 14-day indicator made it to the oversold range, but the 28 and 56-day indicators didn’t. In other words, it’s possible we didn’t see enough selling yet. Then again, over the past six months, the SPX hasn’t needed such a broad reset to move higher.
Whichever way the large cap index is going to move for the next 100 points should be telegraphed within a day or two. For now, the trading range could be reduced to 1,600 to 1,650. Any breakout beyond those barriers could mean another 50 points in the same direction. Be ready and stay nimble.

