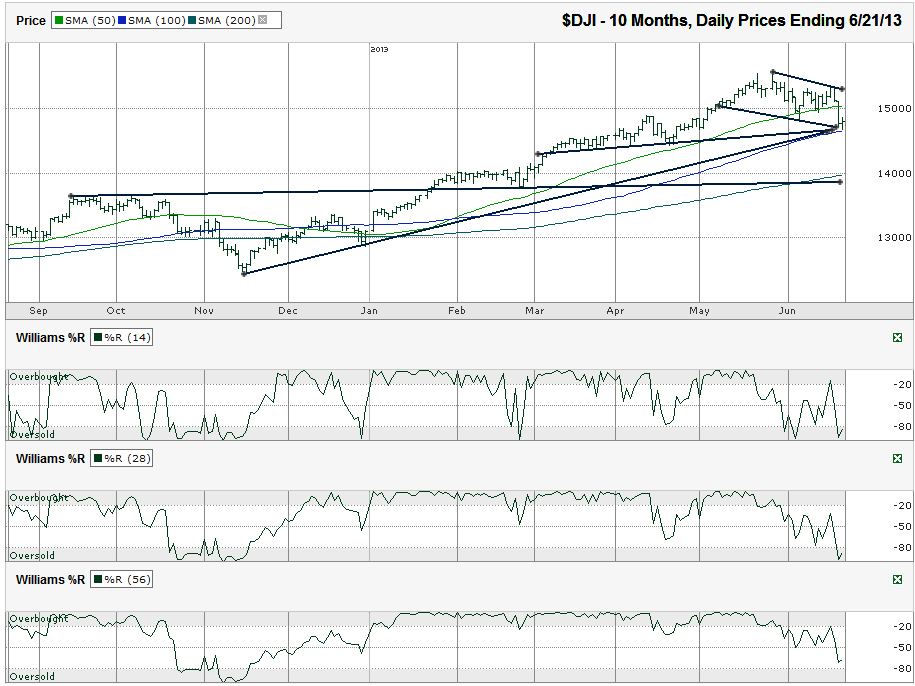
I charted the daily prices for the past six months on the Dow Jones Industrial Average ($DJIA, $INDU, $DJI, the Dow) after the index closed for the week at 14,799.40 on Friday, June 21, 2013.
A month ago, I pointed out that the Dow was looking fragile and we’d likely see a better buying opportunity within three months. Two weeks ago, I questioned if the Dow’s correction had started. As of the end of this week, we can see both of those predictions were accurate. The lows from Thursday and Friday happened to coincide with support from the 100-day moving average (dma) and three important trend lines. This made this support level easy to spot from a mile away, but doesn’t mean it’s guaranteed to last. Support is funny that way. It can cause a short bounce before breaking or can be true longer-term support.
The market is clearly jittery now. A dead cat bounce could take the large cap index up to its 50-dma again for a retest, but that mark might be hard to break in the near-term. The DJIA corrected 5.5% from its intraday high to its intraday low and the downside risk might not be too bad from here. Traders have been asking for a 5% correction for months and because it took so long to get it, I suggested in earlier posts that the correction might be closer to 7-8%. While 5.5% could be all we get with support where it is, a drop to the 200-dma and another long-term trend line would be very close to a 10.0% correction. That means we’re slightly half of the way through the probable scenario for this correction.
Be careful about jumping back in until the 50-dma breaks resistance and holds for a couple of days. At the same time, the latest trend line of lower highs is descending quickly and could come into play within a day or two of any break above the 50-dma. Dropping below the 100-dma where support held this week could be followed by a quick drop of 400-800 points. 400 points lower marks the area close to the March and April lows. 800 points lower is closer to February territory a long trend line and the 200-dma. That should bring about some strong fear among investors and should present a fantastic time to sell naked puts as volatility spikes. For those with a longer time horizon, nibbling in some now shouldn’t be the worst trade you’ve ever made, if you can handle some downside risk before the gains pan out.
The 10 and 20-dma are not shown here, but as noted in earlier posts, have shown a sell signal in their crossing into a bearish pattern. Seeing the reversal, with the 10-dma moving above the 20-dma will be a great buy signal, albeit 3-4% above the bottom. The Williams %R indicator is signaling oversold conditions in the 14 and 28-day views, but not yet in the 56-day segment. A screaming buy signal won’t be clear until all three bottom-out and then reverse. The oversold condition can last for months, just as the overbought condition did. The worst case I can see (so far) is an 18% correction down to the November lows. That seems like a stretch, even with the Fed contemplating losing the reigns soon. They won’t do it if the economy slows. If the economy continues to improve, corporate fundamentals will keep a bear market away. Again, 14,000 seems to be deep enough, but with emotions in play, all bets are off.


