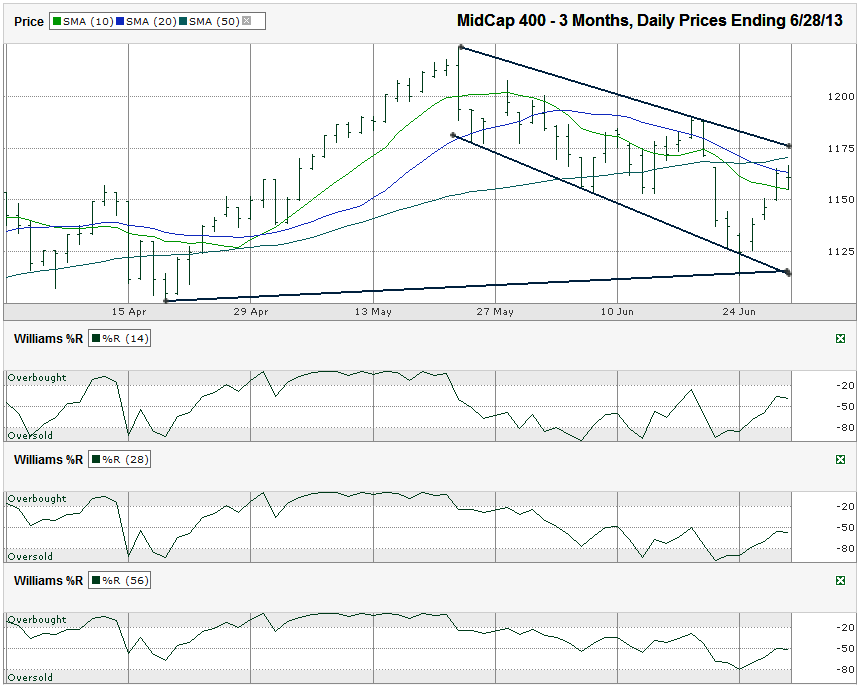
I charted the daily prices for the past three months on the MidCap 400 index ($MID.X, S&P 400) after the index closed at 1,160.82 on Friday, June 28, 2013, the last trading day of the week, month and quarter.
The 20-dma acted as support on Thursday and then broke intraday on Friday, but the midcaps couldn’t hold on to close above it. This moving average is becoming the true line to watch (and it’s descending). Once the 20-dma breaks resistance, the 50-dma is looming and could put up another fight against higher levels. Finally, the MidCap 400 is in a descending trading channel and has simply moved back to the top range within that channel. Until the multi-week trend line of lower highs breaks resistance, the trend will remain in favor of the bears. This trend line is set to converge with the moving averages mentioned above and will move below them soon if the index doesn’t drop quickly again in the near-term.The MidCap 400 faltered with the other major indexes recently and then bounced higher with them this past week. The question becomes, is this just a dead cat bounce or is the rally back on. The first big hurdle for the midcap index was the 10-day moving average (dma). This moving average gave little pause and then became support on Friday. The Williams %R indicator foreshadowed this bullish event by moving above the oversold area on the 14 and 28-day indicators, but eased off on Friday. The second hurdle didn’t work as smoothly.
It could be that the bulls have taken over again and we’ll see new highs before long. However, with such technical interference so close by, there’s little reason to test that weak theory yet. Waiting for the technical indicators to line up better will only cost traders 1.3% of missed opportunity, but could save 5-10% in losses if the index reverses course again in favor of the bears. A move to the bottom of the trading channel would be 3.5% below Friday’s closing mark. That shows more downside risk than upside potential. Patience is key right now.

