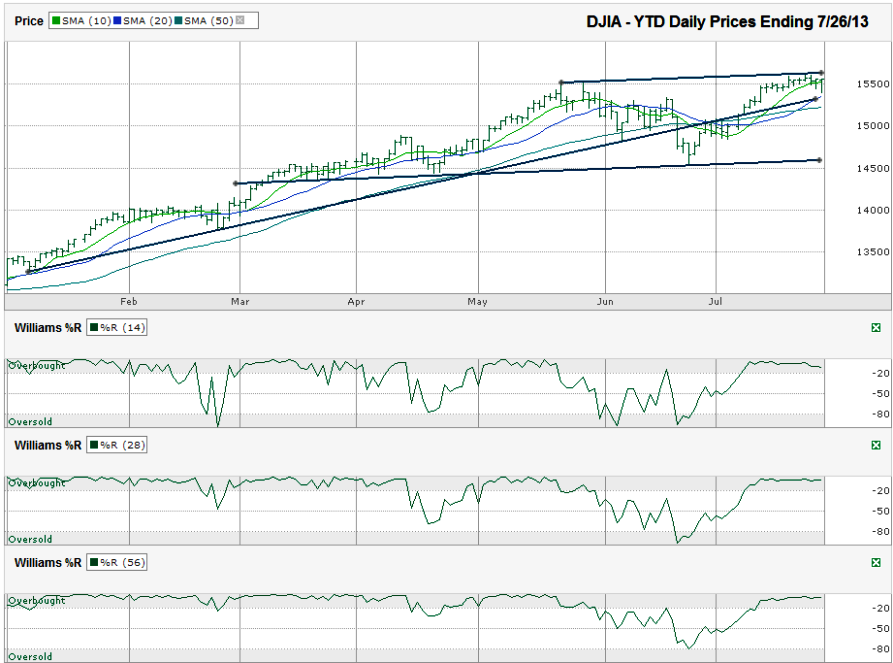
I charted the daily prices for the year-to-date on the Dow Jones Industrial Average ($DJIA, $INDU, $DJI, the Dow) after the index closed for the week at 15,558.83 on Friday, July 26, 2013.
The 20-dma moved above the 50-dma a few days ago and that’s a bullish signal, but it may be late in the cycle as the shorter moving average is ascending quickly and will be tested soon. Traders need to watch for support at the 20-dma and then a bearish crossover could be coming soon for the 10-dma to move below the 20-dma. The 50-dma will still be the next line to watch for support, but its significance has diminished some since the beginning of June when it broke support.The DJIA has shown some weakness lately. That seems weird to write since it crested early in the week at all time highs. The vulnerability on the chart is seen in the mostly sideways direction the index has run in recently. Even with new highs being marked a few days ago, the 10-day moving average (dma) caught up with the DJIA. This “catch” lead to the Dow falling below the 10-dma intraday in each of the past three days. On each of these instances, the Dow managed to fight back above the moving average, but it is a clear indication that the momentum has slowed. A slowing of momentum is often followed by a correction, even if only a few percent lower.
The more telling indicators could come from the trend lines. The longest trend line broke soon after the 50-dma broke and will only be worth noting as a small hurdle. The bigger trend line to watch started in March and marks the trend line of higher lows that has not been broken for nearly five months. A retracement to this trend line would be a correction of approximately 6.5%. Just as in June, this drop could be all that’s needed to shake out the froth and bring in the buyers again. A break of this trend line could be the start of a more serious correction, but until a major macroeconomic change occurs, this risk is fairly low. That theory will be tested this coming week with a lot on the calendar.
Further weakness in the industrial index is not guaranteed by any means. The Williams %R indicator is still showing positive momentum on multiple timeframes and traders are watching the trend line of higher highs for any sign of a break out. Even without a breakout, the index still has room to inch higher. A real reason to add to a bullish position will come when this trend line breaks resistance. Get ready for an exciting week. There’s little chance it’ll be as calm as this past week.

