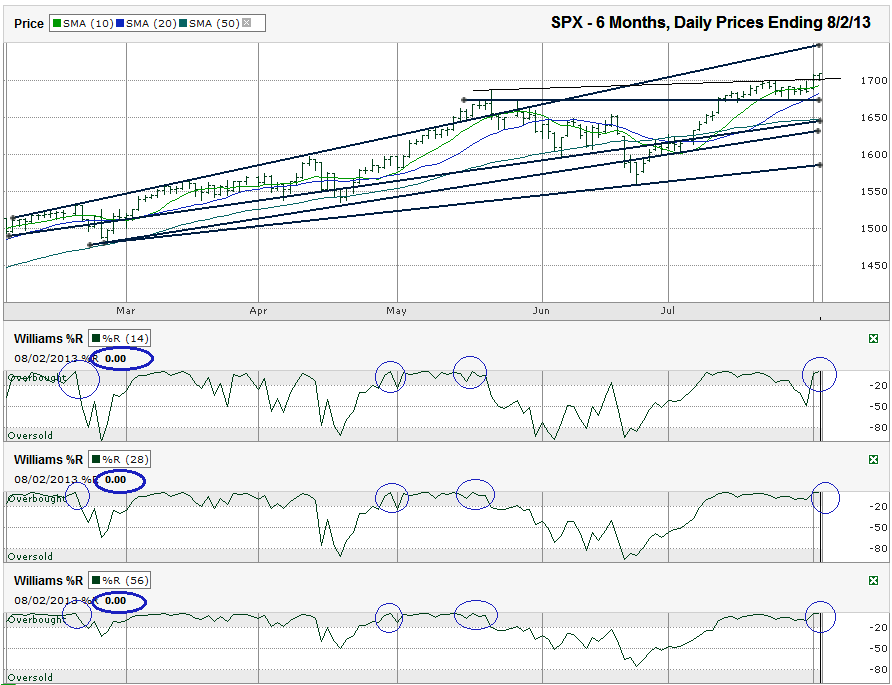
I charted the daily prices for the past three months on the S&P 500 index ($SPX) after the index closed at 1,631.89 on Friday, August 2, 2013.
When I charted the SPX last month, I commented that if the 50-day moving average (dma) held support the bulls would be in charge and new all time highs would be on the way. That’s exactly what happened and now that we’re there, it’s time to figure out the next move. After flirting with the 10-dma for seven days of intraday crossovers, the SPX finally moved above it and had a confirmation day. This looked like it might have been the beginning of a correction, but appears to have been a consolidation period. The SPX could retest the 10-dma one more time and if support holds, the rally could be back in full swing.
The line of resistance that was the short trend line of higher highs held the index from advancing for more than a week, but that line broke on Friday and then acted as support. Keep an eye on this thin line I drew below, very close to 1,700. Even if breaks, the more important line is still around 1,675. This line marks previous resistance that turned into support. The horizontal trend line is important because it’s now below the 10 and 20-dma where the slope gets very slippery.
As I’ve mentioned numerous times, the crossover of the 10-dma below the 20-dma is a bearish indicator. The ability for the index to avoid such a crossover after these moving averages converge is a bullish indicator. Such an event shows a consolidation just passed and the bulls didn’t rollover. That looks like what is forming now. The next day or two should confirm that or debunk it.
The upside potential has opened up during this consolidation. Based on the six-month trend line of higher highs, the large cap index has room to run another 50 points or 3% before facing major resistance again. At the same time, the SPX is closer to the top of its widening trading channel than it is to its bottom. That leaves about 6% of downside in play before the lowest trend line of high lows comes in for support.
The Williams %R indicator hit 0.00 for the 14, 28 and 56-day intervals on Friday. For whatever reason, %R doesn’t work the same way on the top as it does on the bottom (-100). Of the past three times this triple 0.00 showed up, two foreshadowed no more than a few points lower in the following week. The third foreshadowed the beginning of the last decent correction. In other words, don’t bet the farm on a correction yet, but don’t be shocked by it either. The smarter move is to be alert and recognize a change could hit soon. Wait for the indicators to fall below overbought before making any major changes.
Multiple layers of support are close by and could foil any moves the bears attempt. If the 50-dma breaks support (3.5% below Friday’s close), the odds change considerably, so certainly don’t fall asleep at the wheel. A break in the 50-dma would coincide with a break in one or two trend lines and that could trigger a variety of automated sell orders.


