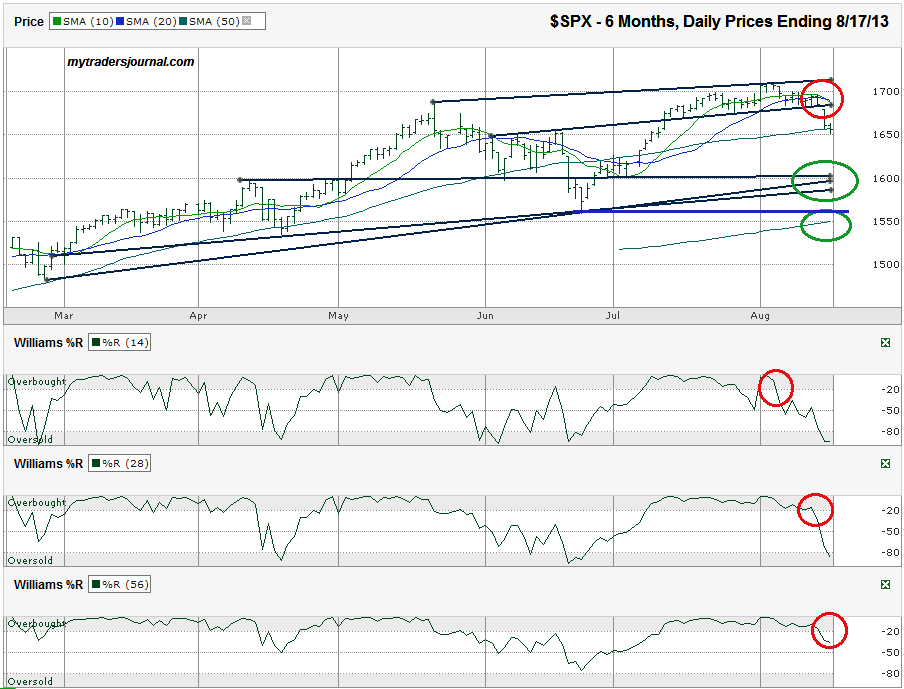
I charted the daily prices for the past six months on the S&P 500 index ($SPX) after the index closed at 1,655.83 on Friday, August 17, 2013.
By the close on Friday, the S&P 500 was sitting below its 50-sma and its 10 and 20-sma were both descending. In addition, the Williams %R indicator showed sell signals for its 14, 28 and 56-day indicators. The next level of support might be 20+ points away at the 100-sma (not shown). If that doesn’t hold, another 35-85 points could vanish quickly. Multiple trend lines come into play around the 1,600 area and then the 200-sma could be the final area of support before 1,550 breaks. The previous recent low from June was at 1,560, but many traders do not expect these low water marks to be tested again before buyers come in.The SPX has been flirting with danger for the past few weeks as it repeatedly crossed over its 10-day simple moving average (sma). More recently, the 20-sma started having the same crossover pains. As is typically the case when these warning flags go up for this long, the index finally cracked and fell below both of these moving averages and allowed the 10-sma to fall below the 20-sma, a bearish signal. The 50-sma caught the falling index on the initial drop, but couldn’t hold it the following day.
The last buyers-boycott kicked off by Fed tapering fears knocked the SPX 7.5% lower from intraday high to intraday low. If the index repeats this cycle, the SPX should start to rebound around 1,580. This reversal point would roughly coincide with one of its trend lines of higher lows and add to the reasons for the bulls to rejoin the party. A fall down to the 200-sma would take the index 9.3% lower (or less depending on how long it takes to get there). From there, value investors should start scooping up “cheap” stocks.
The big unknown is how earnings estimate revisions will affect valuations. What looks relatively cheap now, might not be so appealing if revisions hit estimates too hard. Without a major bubble in valuations yet, the 200-sma has a strong chance of being good support, if the index even gets that low. The buy-the-dip camp is still expecting this downturn to be shallow. Such consolidation periods are healthy for a longer-term bull market. Until 1,600 and 1,550 break support, long-term investors have little to fear. Short-term investors might be able to save some cash by playing the move in both directions. Watch the 50-sma as the guide for the next few days. A re-test of the 10/20-sma is possible, but it’s hard to get overly bullish until the SPX moves above these shorter moving averages.


