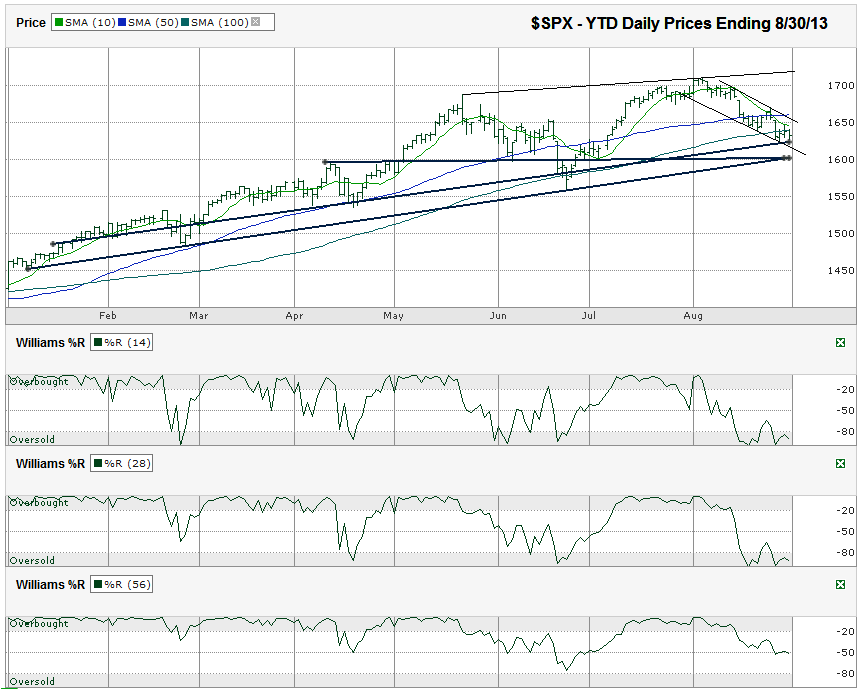
I charted the daily prices for the year to date on the S&P 500 index ($SPX) after the index closed at 1,632.97 on Friday, August 30, 2013.
The spoiler in that bearish call could be support from the higher trend line of higher lows that ignores some of the short-lived moves below the trend line. The reinforcement for the bearish call could be from the 10-day simple moving average (sma) and the 100-sma. Both of these moving averages are acting as resistance and the 10-sma is on a path to fall below the 100-sma. This crossover emphasizes the momentum is pushing stocks lower. Once these two moving averages stop acting as resistance, the 50-sma is only another 15-20 points higher for another tough hurdle.In the past two SPX charts I posted, I pointed at the 1,600 area as a potential area of support for the large cap index when it sold off. 1,600 is only about 33 points away from Friday’s close and continues to show possible support. The short descending trading channel during August shows SPX could have a small bounce before resuming its decline.
The Williams %R indicator gave a “head fake” a week ago in its 14 and 28-day indicators. Those blips above the oversold area didn’t have the confirmation day needed to show the rebound was legitimate. Keep an eye on this indicator for a two or three-day move about oversold to know the momentum has truly shifted. For now, the momentum favors the bears, but it might not be for long. Less adventurous traders could do well to wait for support at 1,600 before jumping in. Those who can handle the risk might not fare so poorly by selling some out-of-the-money puts as volatility picks up. Once the markets reverse, the run back above 1,700 will be quick.
September and October are historically less than stellar months. This year could follow the norm and at the same time be a great entry point. I still don’t expect this correction to go beyond 10% with 7-9% being the more likely reversal point. Retesting the June low at 1,560 would be an 8.7% correction. The 200-sma (not shown) has moved above that mark by a few points and is still ascending. Watch for a huge stand from the bulls before this moving average breaks support, if it even comes back into play this year.

