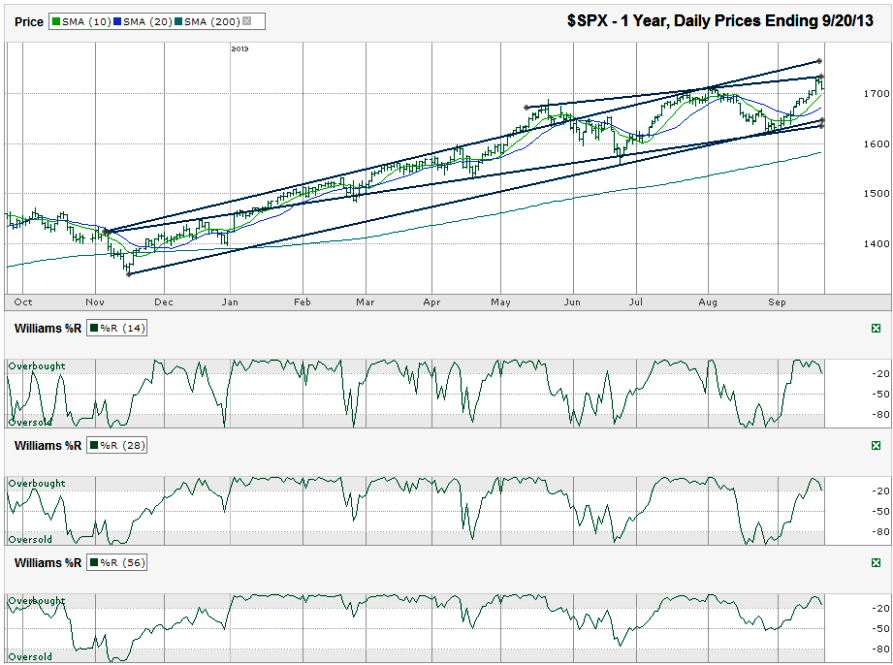
I charted the daily prices for the past year on the S&P 500 index ($SPX) after the index closed at 1,709.91 on Friday, September 20, 2013.
I pulled up a six-month chart when I first charted the $SPX today. I saw this four-month trend line act as resistance and thought, that was a clear reason for buyers to step aside. However, when I pulled back to a 12-month view, I noticed the longer trend line of higher lows that excludes the brief May move above the trend line. It still shows room for the index to run higher by another 50 points or more.The lack of follow-through for the bulls after the Fed’s no-tapering speech this past week just happened to coincide with the recent trend line of higher highs. The first instinct for many traders and pundits was that this could be the end of the bull market. We know the current bull market is already longer than the average bull market, so traders are getting twitchy.
Having room to run and actually running are very different things as any of us who are weekend warriors know. I started checking for other signs. The 10-day simple moving average (sma) recently crossed above the 20-sma. That’s bullish. The 10-sma hasn’t even broken support yet. It won’t be a bearish signal until the 20-sma breaks. I almost expect a retest of the 20-sma as part of the consolidation of the September rally. Williams %R hasn’t fallen below the overbought range in any of my measuring periods. The 200-sma is closing in on the index when compared to how far away it was in May and July. In other words, the index isn’t getting ahead of itself too far yet.
The first major hurdle to the upside will be to get past the Wednesday and Thursday highs and then above the four to five-month trend line of higher highs. If that doesn’t happen within the next week, investors could see more weakness show. The downside has to get through multiple speed bumps before it truly breaks down. The 10 and 20-sma are the first of those. (The 50-sma is not shown below, but is between these other two lines.) Two trend lines of higher lows are close by in the lower 1,600s and either could act as support.
The worst case for the remainder of 2013 seems to be for a mini-correction to take the S&P 500 down to its 200-sma which is approaching 1,600. The $SPX hasn’t moved below its 200-sma this year. Such an event would mark a 7.5% correction. That’s nothing to cry about if the jaunt below the line finds buyers quickly as I expect it will. Support at the 200-sma would give investors who missed the last six months of gains an opportunity to get back in with much less risk. As luck would have it, this area of potential support is slightly above the June 2013 low and that alone could provide a reason for bulls to re-enter and bears to back off. The end could be coming, but the chart doesn’t say it’s here yet.


Nice call on the sluggish performance. I am looking at 1670-1660 for support on the ES and then a rally into the 1740 region.