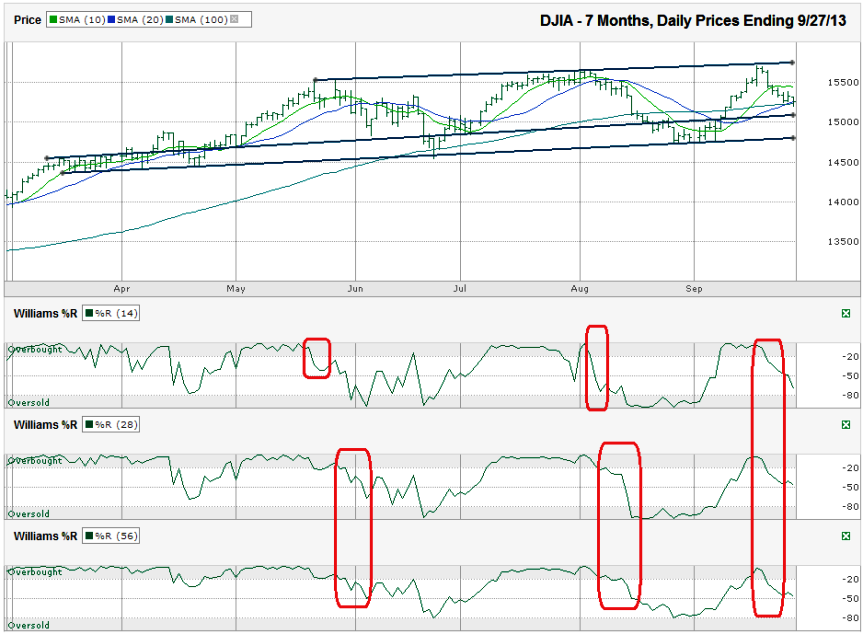
I charted the daily prices for the past seven months on the Dow Jones Industrial Average ($DJIA, $INDU, $DJI, the Dow) after the index closed for the week at 15,258.24 on Friday, September 27, 2013.
The next trend line to watch is very subjective. It cuts through the middle of the wider trading channel, but has acted as speed bumps in the past. Traders should watch this line, but not rely on it. This line could offer a temporary reprieve, but maybe not lasting support. The opportunity for lasting support should come from the trend line of higher lows. It is more than 300 points below Friday’s close and is ascending. This key support area is slightly above the 200-sma (not shown). The 200-sma is ascending faster and could align with the trend line around the time the Dow gets that low.The DJIA has shown some weakness ever since it hit resistance at its trend line of higher highs. The fall has pushed the large cap index to close below its 10-day simple moving average (sma) in every day of this past week. The 50-sma broke support on Wednesday, but hasn’t seen a day fully below it yet. On Friday, the DJIA crossed below its 20 (not shown) and 100-sma, but was able to close above both. Actually, it’s pretty much right on the 20-sma. Any movement below these moving averages sends up red flags, but not closing below them is good news for the bulls.
The bulls shouldn’t get too comfortable with the technicals listed above. Williams %R suggests momentum has shifted. The 14, 28 and 56-day indicators broke below overbought in unison for the first time this year. The previous two times all three fell below overbought, the DJIA continued to slide deeper for longer. The longer push lower could last until support at the trend line of higher lows, but this indicator does not pre-announce turn around points. It simply says now is not the time to buy.


