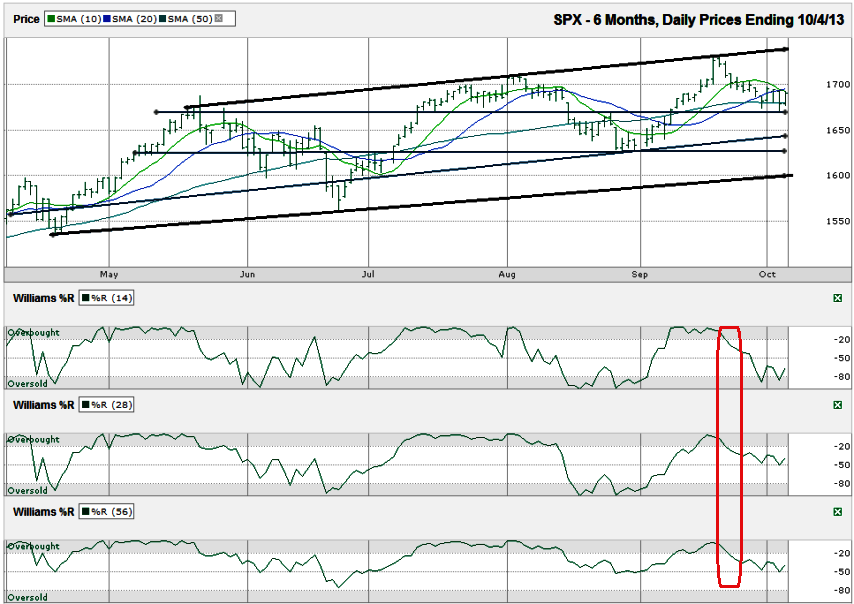
The chart below shows the daily prices for the past six months on the S&P 500 index ($SPX) after the index closed at 1,690.50 on Friday, October 4, 2013.
The 10-day simple moving average (sma) broke support nearly two weeks ago and has acted as resistance since then. The 20-sma broke support at the beginning of last week and has added further resistance to any recovery attempts. By the end of the week, the two lines formed a bearish crossover with the 10-sma falling below the 20-sma. During this past week of consolidation, the SPX fell below its 50-sma twice, but managed to close above the longer moving average both days. While the 50-sma has not held strong support over the past six months, traders continue to view the line as a key indicator for future movement. Stocks have further to fall if the 10/20 bearish crossover holds true to previous accurate forecasts. This descent will not happen until the 50-sma gives up support.The S&P 500 is in an interesting position as the government enters its second calendar week being shut down. Friday’s close left the large cap index in the upper half of its six-month ascending trading channel. This view, taken alone, leaves more room for stocks to move lower than higher, but one indicator never tells the full story.
A horizontal line, around 1670, marks previous support and resistance just below the 50-sma. This line, coupled with the 50-sma, will be a crucial stand for the bulls. If it breaks support, the S&P 500 could lose another 20-40 points very quickly. The next line of support could surface at the middle trend line of higher lows that excludes some of the extreme low points. This ascending line is close to the horizontal line that marks the August low. This area, a retest of previous weakness, has a higher probability of stopping a sell-off. If it fails, the next opportunity for the bulls to make a stand is the uninterrupted trend line of higher lows that moved up to the 1,600 line this past week. Traders will be looking for a key reversal at this point, before a true bear market forms. Stocks will have fallen 7.5% from their September highs and the 200-sma (not shown) will have caught up to the index to offer further support.
In most cases, the Williams %R indicator offers a clear forecast of what is to come. The recent slide was marked by a break in the indicator below the overbought area and traders were given a clear signal to exit aggressively bullish trades. The bullish reversal might not be as easy to see forming this time. The 14-day indicator reached oversold and reversed, issuing a buy signal, but the 28 and 56-day indicators only made it half of the way to a clear bottom. The mixed signals make any reversal less obvious, but do not rule out the chances that the index is beginning its path back towards its trend line of higher highs, approaching 1,800.

