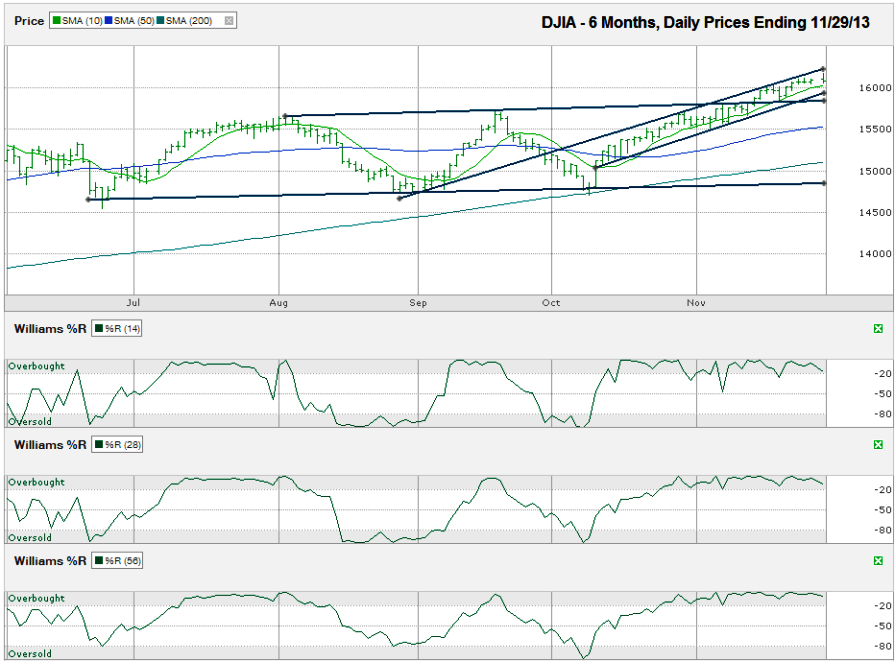
I charted the daily prices for the past six months on the Dow Jones Industrial Average ($DJIA, $INDU, $DJI, the Dow) after the index closed for the month at 16,086.41 on Friday, November 29, 2013.
The trend line that was resistance in July, August and September could be the next area of support. As mentioned here previously, trend lines that previously acted as resistance often act as support once breached. The 20-sma fits in there too, but I left it off of this chart to include the 50 and 200-sma lines.The DJIA has run in a tight trading channel since the first half of October and hasn’t shown reason to sell yet. We all know that day will be here eventually, but until it happens, there’s little reason to change course. The large cap index stayed above the 16,000 mark throughout the holiday-shortened week. This round number coincides with the Dow’s 10-day simple moving average (sma) and will soon have the rising trend line of higher lows as additional support. Watch for a break in any of these three points as a hint that weaker days could be on their way.
The 50-sma is nearly 600 points below the recent high on the DJIA. That might sound big, but it’s not even 4%. Traders need a 4-8% correction to shake-up the tight trading range. The 50-sma could be an excellent turning point for support. A fall down to the 200-sma would only be a 6% correction. This retest of the 200-sma was all the market needed to restart its rally in October. Traders should expect the same before too long. Even a brief fall down to the trend line of higher lows doesn’t even hit the 8% mark.
The downside still seems limited based on the known unknowns, such as when and by how much the Fed will begin tapering and what broad economic numbers will show for the economy in the coming months. Any turn that takes the Dow more than 8-10% lower will likely come from a surprise catalyst. The US economy continues to improve, slowly. Fear is still present among investors and until a shock hits the Wall Street, I don’t see a valid reason for a long-lasting mass exodus from the bull market for many months to come.


