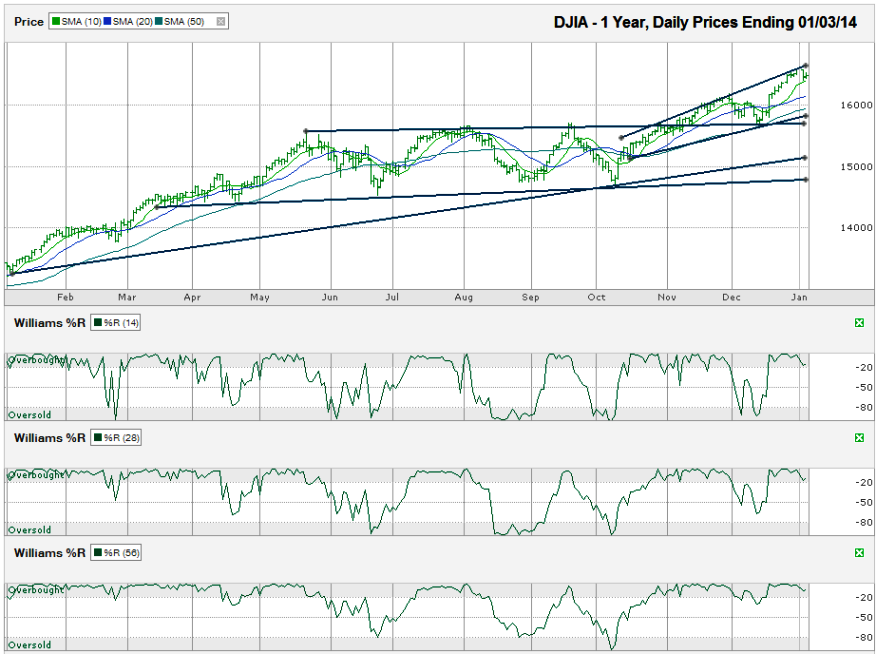
I charted the daily prices for the past year on the Dow Jones Industrial Average ($DJIA, $INDU, $DJI, the Dow) after the index closed for the month at 16,469.99 on Friday, January 3, 2014.
The index fell as low as its 10-day simple moving average (sma), but hasn’t fallen below it yet. When it does, which might not be this coming week, expect a run down to its 20-sma at a minimum and possibly as to its 50-sma before it pauses. Watch the Williams %R indicators for an added warning sign. For now, they haven’t shown a capitulation is coming. Monday will give better insight for the real momentum.The DJIA chart didn’t show any real breakdowns through all of 2013. Traders have to wonder how long this can last. After a long consolidation phase that ran from May through October, the Dow broke out to new highs. The calendar change brought some profit taking for those who wanted to push their capital gains into the new year, but the chart hasn’t broken down yet.
The 50-sma is close to the near-term trend line of higher lows and not too far above the long line of resistance that became support in December. A drop down to retest the previous support line would be a little more than a 5% correction. The market needs at least this much of a consolidation period before putting in its next solid leg in the bull market. A decline down to the longest trend line on the chart below would equal more than an 8% correction and should act as an excellent buying opportunity.
Unless the momentum from economic fundamentals change, buyers could start creeping in closer to the 5% mark with the expectation of no more than an 8-9% correction. After losing 5%, the downside risk will be substantially reduced while the upside potential starts to outweigh these risks. After the next correction, the Dow Jones should have a minimum of 15% upside, if not 20%.

