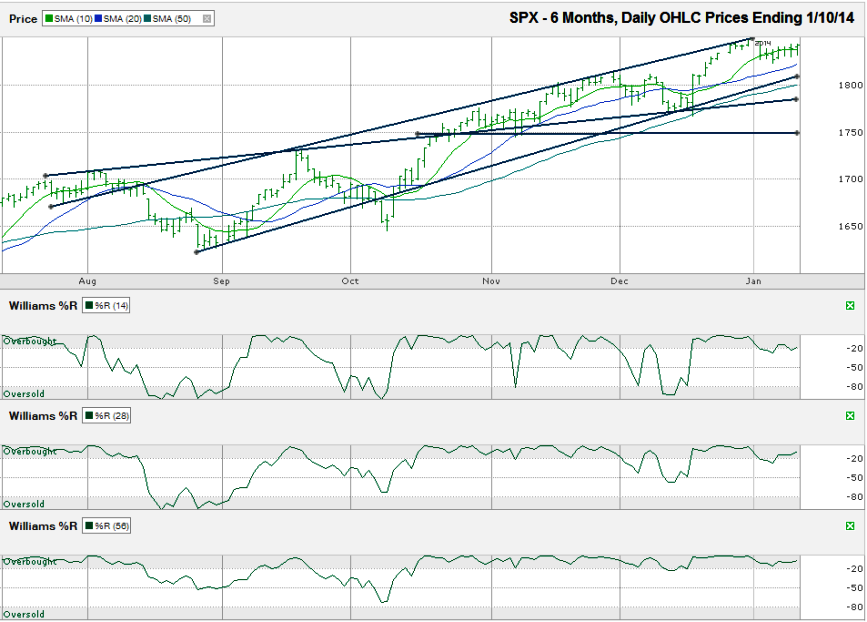
The chart below shows the daily prices for the past six months on the S&P 500 index ($SPX) after the index closed at 1,842.37 on Friday, January 10, 2014.
The sideways movement over the first seven days of the year has given the 20-sma time to draw in closer to the 10-sma. If the index moves sideways for another week, traders could see the 10 and 20-sma break support on the same day. The 10-sma will move lower quicker than the 20-sma and any crossover of the two moving averages will act as another bearish signal, but not until the trend line of higher lows stops supporting small dips.The S&P 500 has been in an ascending trading channel since the end of August. The trend lines of higher highs and higher lows that define this channel have not broken support since early October. However, the index has some warning signs to watch now. Starting on the first trading day of the year, the SPX fell below its 10-day simple moving average (sma). A break in this basic technical indicator can act as a precursor to larger breakdowns in stock prices. The intraday crossing of a moving average is enough to draw attention to it, but SPX has not had a full day trading below its 10-sma yet and therefore has not had a full break yet.
The 50-sma is also closing in on the current SPX level. The 50-sma has not been as reliable of a predictor over the past six months, but did provide support in December and is worth watching again if it comes back into play soon. A retest of the 50-sma would only equal a 2.5% mini-correction, but a break below the 50-sma could trigger automated selling from computer algorithms. The result could be another 50 points to the downside where potential support is possible from the horizontal trend line used in late October and early November. A fall to 1,750 would be slightly more than a 5% drop from the all-time high set on New Year’s Eve.
A 5% correction would bring the 100-sma (not shown) into play for potential support and could be enough of a consolidation to bring the bulls back into the market as bargain hunters begin picking up stocks at a discount. If not, the next area of support should be stronger at the 200-sma, which is close to 1,700 and nearly 8% below the all-time high. Unless the macro-economy is hit with a large fundamental change or a large number of key companies issue poor earnings releases, stocks should not fall more than 8-10% during a consolidation period.
The Williams %R indicator has not signaled it is time to take profits yet. While the 14 and 28-day indicators fell below the overbought range, they both recovered quickly before they had multiple confirmation days. The 56-day indicator has not fallen below its overbought range since it predicted the short-lived drop that began in September. If it stays positive, the S&P 500 could quickly return to the top of its ascending trading channel and record new all-time highs.


