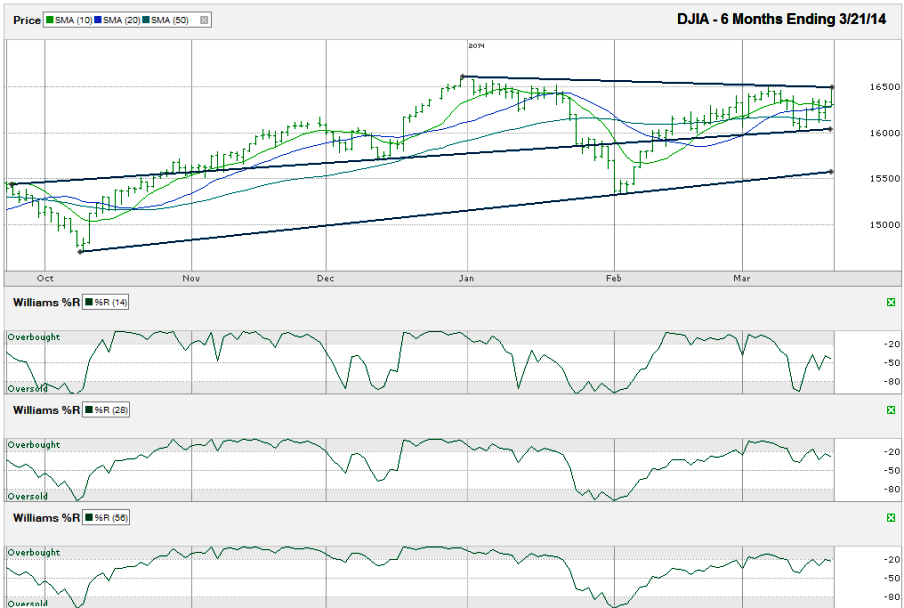
I charted the daily prices for the past six months on the Dow Jones Industrial Average ($DJIA, $INDU, $DJI, the Dow) after the index closed for the week at 16,302.77 on Friday, March 21, 2014.
The DJIA is still slightly below its 2013 closing level, but up from its dip that ended in early February. As always, the question comes back to, what now? Charts can often foreshadow the upcoming direction, but this chart doesn’t give a fully clear set of signals yet. Here are some technical indicators to watch out for to help predict how the market could swing in the coming weeks.
The caveat to going too bearish too soon comes from potential support emerging from the 50-sma and a longer trend line of higher lows that are only a couple of hundred points below Friday’s close. While the 10/20-sma crossover will provide an early warning of the bears’ control, a fall below the 50-sma and the trend line of higher lows will send in major selling from the computer algorithms that truly control the markets these days.On Friday, the Dow hit resistance in the first minute of trading at its trend line of lower highs that started at the end of December. If the Dow cannot break above this descending line soon, we could see the index drop as much as 1,000 points from its recent high. The recent consolidation has given the moving averages time to draw in closer to each other. The 20-day simple moving average (sma) caught up to the 10-sma by Friday, but the two lines provided support for the Dow in the afternoon. If these moving average lines do not continue to hold support, we’ll see a bearish crossover with the 10-sma moving below the 20-sma. This is often an early warning for weeks of weakness.
Such a programmed sell-off will force the DJIA into a slide that could quickly run another 4-500 points in just a few days. A fall to the 200-sma (not shown, ~15,650) might be enough of a mini-correction. However, we could see a move down to the unbroken trend line of higher lows that started in October, around 15,550, or even a retest of the February low of 15,340.
It’s not just the moving averages and trend lines that are worth watching. The Williams %R indicator has raised some red flags too. The 14-day indicator fell below the overbought range on March 11, showing a sentiment change had begun. A couple of days later, the 28 and 56-day indicators also moved below the overbought range, but these latter two time views moved higher before getting a second confirmation day. If they turn lower again to start this week, a true shift in momentum and sentiment will be in place and traders might want to consider taking some profits and waiting for a better entry point a little lower on the chart. Then again, if resistance breaks at the trend line mentioned above, traders could see new highs for the Dow very soon.

