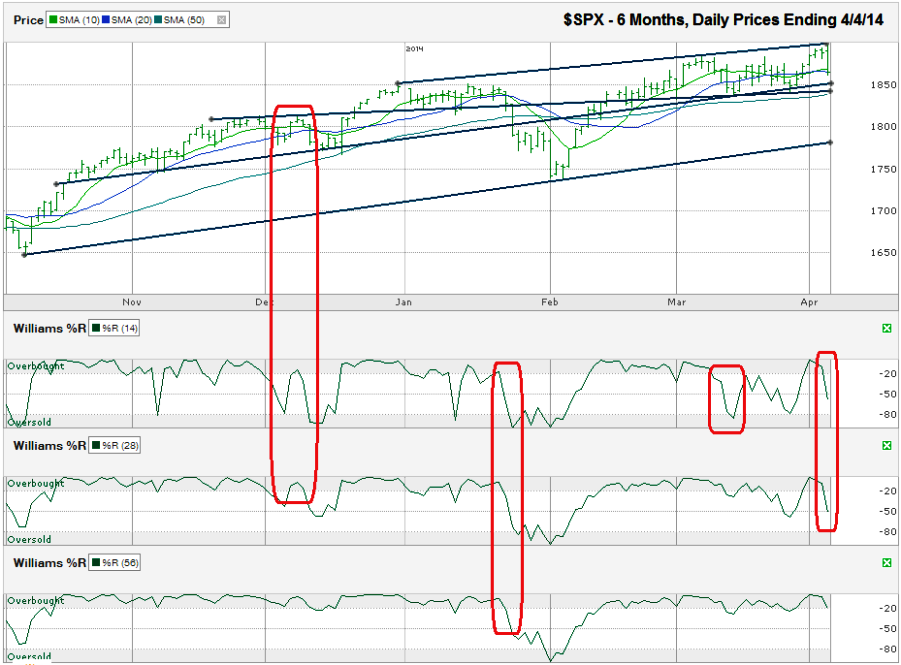
The chart below shows the daily prices for the past six months on the S&P 500 index (SPX) after the index closed at 1,865.09 on Friday, April 4, 2014.
Traders will be watching to see if the trend line of higher lows holds support at the beginning of the week. If not, the SPX could slip to its lower trend line of higher lows last touched more than two months ago. A retreat to this trend line would only be a 6% correction, but could be all that’s needed to clear out some nervous investors. If the trend line of higher lows does not stop the slide, the S&P 500 could retest the October 2013 low, just below 1,650. This much of a sell-off would surpass the (some say overdue) technical definition of a market correction (10%) and allow the bulls to take over again after losing 13%.The S&P 500 began Friday morning by hitting a new all-time high in the first few minutes of trading. After a couple of failed attempts, the bears finally took control and pushed stocks lower in a steady decline until the final 75 minutes of the day when the bulls and bears called a truce for the day. Panicky traders were able to take the large-cap index to its trend line of higher highs and then back down, close to its trend line of higher lows. This trading range has defined most of the past six months of movement outside of a few weeks that bottomed in early February.
Until stocks break out above the trend line of higher highs, the path of least resistance is lower. Friday’s sell-off sent the SPX below its 10 and 20-day simple moving averages (sma) where the index has spent much of the past few weeks. Two weeks ago, the 10-sma fell below the 20-sma. This inversion is considered a bearish technical indicator, but it failed to foreshadow a lasting sell-off on the first try. Traders will keep a sharp eye on these moving averages over the coming week because it is rare for the signal to give two false indications within a month. The second crossover has a high probability of foreshadowing a bigger correction, if it happens.
The Williams %R indicator doesn’t help the bulls’ hopes either. The 14 and 28-day indicators both fell below the overbought range on Friday. After the previous three occurrences when this happened, stocks moved lower in the following days. To forecast a more meaningful decline, the 56-day indicator needs to follow suit and have two confirmation days, as it did in late January when the market corrected 6%.
The 50-sma has to break support before any bear attack becomes substantial. Coincidentally, the 50-sma is converging with a trend line that acted as resistance in late 2013 and support in multiple instances for the year-to-date. If the S&P 500 falls below these lines (close to 1,850), expect the high frequency traders’ algorithms to kick into high gear as mass selling hits stocks. Any steep decline might be short-lived unless economic conditions suddenly worsen or a macroeconomic factor surprises traders.

