June was another good month for my account as I added to my year-to-date gains and got back above an average of 1.0% per month. I’ve fallen off my trading over the past couple of weeks due to my mother-in-law’s passing preceded by a couple of weeks in the hospital for her. I added a new client in the middle of that time and have been spending a lot of time getting her established and explaining how her previous advisor was robbing her with mutual funds that had fees as high as 2.14%. The World Cup has taken away some of my time from my desk as I slipped away early on more than a few days. A lot of the outside influences won’t keep me from working my personal accounts soon, but still have a little more to catch up on for my business after doing very little work/trading last week.
I ended July with a Net Liquidation Value (NLV) of $106,424.95 and a Net Asset Value (NAV) of $106,569.47 according to Interactive Brokers (IB) after finishing May with an NLV of $104,672.19. That gave me a gain of $1,752.76 (~1.67%) on paper for July and a realized gain for the month of $2,524.00 on five closing trades. I received no dividends in July since I still don’t own shares of any stocks or ETFs in this account. Quicken reported that I have $106,569.47, in line with IB’s reported NAV, but only after I added a $0.01 deposit to reconcile the difference from a rounding error Quicken didn’t catch from Interactive Brokers on June 20th. I looked at the details of my three trades from that day and couldn’t find which trade was off, but the cash balance in Quicken was a penny short.
I have three UWM July puts I might close as soon as tomorrow to get them off my books, but I could easily leave them until expiration and let them expire worthless based on how far out-of-the-money they are now. I should probably close my FB August $55 put too for an early profit. I’m debating closing my SPY October $180/160 long put spread and raising the strikes some to keep up with the rising prices of stocks. Then again, if I don’t get some more puts sold, I won’t have much to hedge against.
As I said last month, I need to put more money at risk to reach for better returns. In June, I cut exposure more than I added it and have to find time to remedy that sooner than later. If all of my naked puts were assigned, I would be 78.27% invested in this account (72.91 if I include my long put spread hedge). June’s ending allocation is 13.20 percentage points lower than how I closed out May. With volatility so low, it’s fairly cheap to hedge and if I am hedged, I can handle more exposure. It keeps coming back to the fact that I need to make more trades.
My MDY September $265 and FEZ August $44 naked puts are the only options in my account that’s in-the-money and they are both almost at-the-money including today’s gains so far. The rest are getting cheap and need to be adjusted probably.
This is my asset allocation in my IB account as of the end of June:
- Large-cap ETF: 0.0%*
- Mid-Cap ETFs: 24.90%
- Small-Cap ETF: 28.56%*
- International: 8.27%
- Oil: 0.0%
- Individual Stocks & Other Sector ETFs: 7.75%
- Bonds: 0.0%
- Short ETFs: 0.0%*
* Does not include put spread hedges on SPY and UWM.
These are my returns according to Quicken through June 30, 2014:
- YTD Return: +6.54%
- 1 Year Return: +19.24%
- Average Annual (not cumulative) Return since November 18, 2009 (when I opened my IB account): +8.34%
According to Morningstar, here’s how I compare to the major indexes (including dividends) through the month’s last trading day, June 30, 2014:
- Dow Jones Return: YTD change +2.68%, 1 year change +15.56%
- S&P 500 Return: YTD change +7.14%, 1 year change +24.61%
- NASDAQ Composite Return: YTD change +5.54%, 1 year change +29.53%
- Russell 2000: YTD change +3.19%, 1 year change +23.64%
- S&P Midcap 400: YTD change +7.50%, 1 year change +25.24%
The VIX ended the month at 11.57 and the VXN ended at 12.21. These readings are mixed with the VIX a tiny amount higher and the VXN a little lower. Both are still on the very low side of historical levels as stocks’ fluctuations seem a thing of the past. We all know volatility will return and as I said above, it’s probably a good time to buy some insurance in the form of long puts. However, just because the VIX is low doesn’t mean a sell off is going to hit in the near-term.
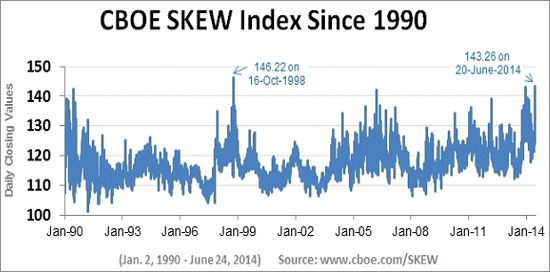
Since I started tracking last month, the CBOE SKEW Index, which finished June at 139.35, is looking more restless. Check out the chart below that shows the increase in SKEW’s closing daily values. A couple of weeks ago it hit the highest level in nearly 16 years. One of the last big spikes was around 2007. This could be misplaced fear, but could also mean large investors are expecting a top soon and they might get into a jittery selling mood soon.

