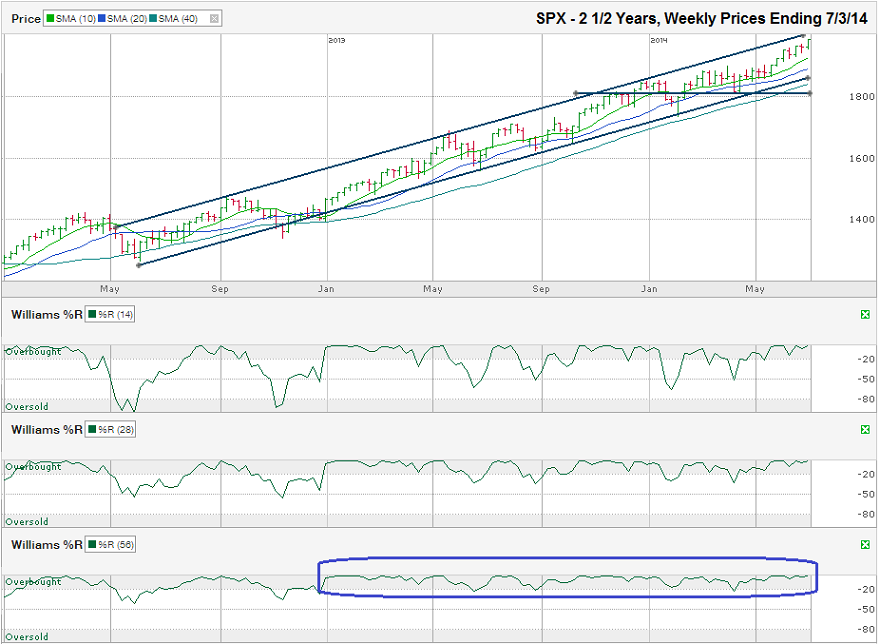
The chart below shows the weekly prices for the past two and a half years on the S&P 500 index ($SPX) after the index closed the week at 1,985.44 on July 3, 2014.
By the end of the first week in July, the SPX had moved back near the top of its trading channel marked by its trend line of higher highs with a little more room to move higher before facing its next technical challenge. Bulls will point out that reaching the top of the trading channel does not foreshadow an immediate sell-off. The index can trade sideways or down only a few points before finding a reason to resume its climb with more room to ascend.The S&P 500 reached an all-time closing high on Thursday to finish a holiday-shortened week on the back of a positive employment report in the morning. Reaching new highs has been a regular occurrence for the large-cap index this year. For more than two years, the SPX has been in an ascending trading channel that has made investing look easy and without risk. Eventually, stocks will fall below this extended tight trading range and will catch some investors by surprise. Traders can avoid some of this surprise by watching the charts.
Bears will wait for the smallest catalyst as a cause to push stocks lower. The cause of the reversal and how much longer the current trend lasts will determine how much lower stocks fall. Any selling in the near-term could find a support level around the 10 or 20-week moving averages and the SPX will be able to remain in its trading channel. Even the 40-week moving average (similar to the 200-day moving average) is close to the trend line of higher lows. A mini-correction to the 40-week moving average would only be a 7% drop for the S&P 500. A drop of this size should be a welcome buying opportunity, as the bulls would view it as a healthy step back after more than a few steps forward.
If the bears can push the index below the trend line and the 40-week moving average, as they did in late 2012, support could surface around 1,800, roughly 9% below Thursday’s closing level. If the SPX can reach a few points higher before starting its correction (and little data says it won’t), traders could see a full 10% correction before any major levels of support break. The current bull market has run well past its average length of time between 10% corrections and has many traders on edge. A quick 10% drop for the large-cap stocks that make up the S&P 500 could be viewed as a welcome reset and act as a launching pad for the index, much as the small-cap Russell 2000 index rebounded fast from its recent 10% correction.
The Williams %R indicator could be one of the first predictors of any move towards a 10% correction. The 14-day view will raise the first red flag. Traders should watch for a move below the overbought area. This drop will coincide with a fall below the 10-day moving average and bring out some automated selling from the computer algorithms. The 28-day view will act as a confirmation that momentum is shifting, but could be premature to predict a true correction has begun. The 56-day view hasn’t fallen below overbought by more than two points in 2014 and those days did not have a follow-through that would indicate the bulls lost control. When the 56-day indicator shows a break below the overbought area, traders will know the bears have the reigns and should expect the year’s first correction is likely in process.


This run is impressive and scary at the same time. Not even a blip. Is this sustainable? I do not know (well, I know it is not, but do not know when this all falls).
This remains me to continue increasing cash, because as this falls down, it will make a huge noise along with it and I want to be ready to survive it.