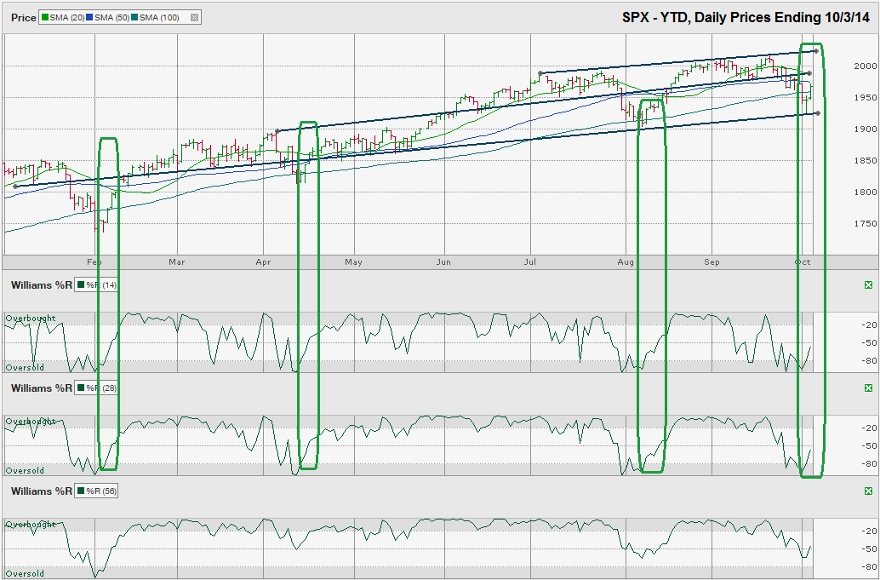
The chart below shows the daily prices for the year-to-date on the S&P 500 index ($SPX) after the index closed the week at 1,967.90 on October 3, 2014.
Before the market opened the next day, index futures were predicting a positive open as the reigns were being handed back to the bulls after a 4.6% mini-correction. When the monthly jobs’ data showed better than expected data, the bulls had more than technical indicators on their side and the S&P 500 gained more than 1.1% on the day. On the way higher, it paused at the 100-day moving average briefly, broke through it and then came back to retest it before moving another leg higher. Late in the afternoon, SPX met resistance at its intraday high from two days earlier, just a few points shy of its 50-day moving average.The S&P 500 marked an all-time high of 2,019 on September 19. This peak coincided with its trend line of higher highs and acted as resistance to further gains. The following day, SPX fell below its 20-day moving average and technical traders seized the opportunity to sell while the bulls lost momentum. The bears were able to push the large-cap index below its 50-day moving average within three days. Four days later, the selling pressure pushed SPX below its 100-day moving average. The following day, the SPX found support from its trend line of higher lows and reversed mid-day.
Technical traders who follow the Williams %R indicator saw the weakness forming on September 22, when the 14 and 28-day indicators fell below the overbought area, a bearish signal. On September 23, the 56-day indicator broke below the overbought area and a clear momentum shift was underway. All three indicators bottomed on Wednesday, October 1 and reversed course on October 2 as the bears stepped aside.
Before the bulls can ring the victory bell, the SPX needs to break through the 50-day moving average and log two confirmation days of continued momentum on the Williams %R indicator. A follow-through on higher volume will give the rally more credibility as the index faces resistance at the middle trend line in this chart. Trading through the middle trend line will open a clear path to new highs and a retest of the upper trend line. From there, the battle starts over.

