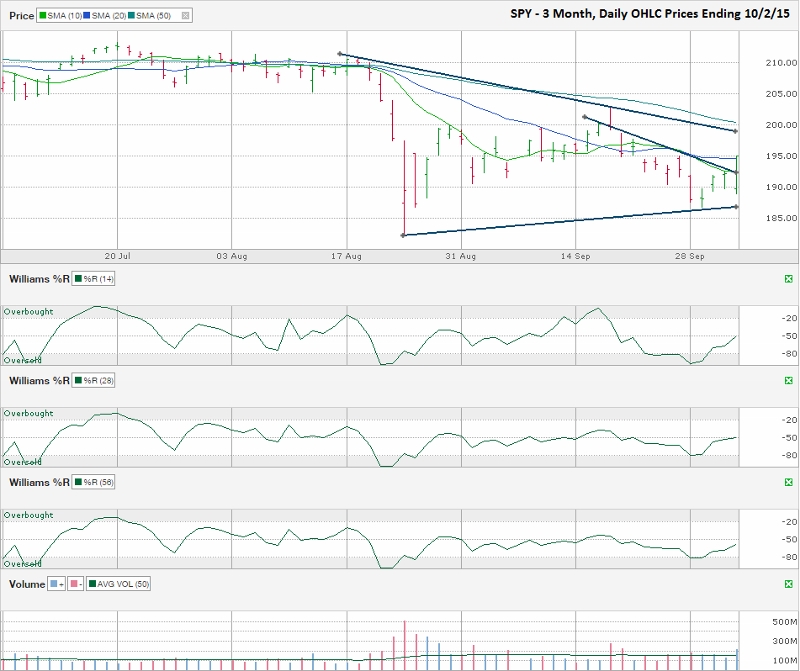
The chart below shows the daily prices for the past three months on SPY, an S&P 500 Index ETF, after closing the week at $195.00 on October 2, 2015.
For some traders, the tantrum seemed over. SPY had finally had its long-overdue correction with a 14.7% drop from an intraday high of $213.78 in May. To technical traders, the recovery seemed false and merely what is referred to as a “dead cat bounce” (as in, even a dead cat will bounce if it falls hard enough). To truly reset technically, SPY needed to retrace most, if not all, of its collapse on a calmer descent.SPY went through a long consolidation period from early February through mid-August when it did not waiver more than nine points from its high to low. No news could push the large-cap ETF below 204 or above 214, with the majority of days trading between 207 and 212. The 10, 20 and 50-day moving averages all converged during the final month of tranquility as SPY’s trading range narrowed to an even tighter range. This period of complacency ended in mid-August when SPY fell in a two-day panic attack as low as 182.40 before recovering to 189.50 by the end of the day.
On Monday, September 29, SPY made it as low as $186.93 before closing above its previous day’s closing price. The next three days followed suit with better closes each day. The biggest challenge came on Friday after Thursday’s advance was halted at its 10-day moving average and its two-week trend line of lower highs. The poor employment report on Friday morning added onto the technical resistance and it looked like the recovery might stall after only three days. After dropping 3.01 points in the first hour of trading, SPY rallied 3.1% to finish at $195.0 close to its high of the day, above the descending trend line that stopped it the day before and above its 10 and 20-day moving averages.
To give the rally credibility, the bulls need SPY to stay above $195 on Monday. Moving averages and trend lines are very important to technical traders, which makes Monday’s trading range a psychological make it or break it point. The area around $195 has been important resistance and support since the correction hit SPY. Closing above $195 on Monday will show traders that the past four days of better prices is more than a short-covering rally. In addition, the Williams %R indicator moved above the oversold range on Wednesday and needs three confirmation days to make the signal more reliable. A higher close on Monday will give this momentum indicator its third confirmation day. A lower close on Monday could take the legs out from the rally and cause a retest of the August lows.
We are far from seeing an all-clear signal above $195. Another trend line of lower highs has moved below $200 and the 50-day moving average is just above $200 and falling. Both of these points of potential resistance will draw a lot of attention in the coming days if SPY’s push higher continues. A move above the 50-day moving average will give the market a chance to trade up to its previous highs from the spring again. The chart will need a completely new technical assessment by the time SPY reaches the $210-214 range again.

