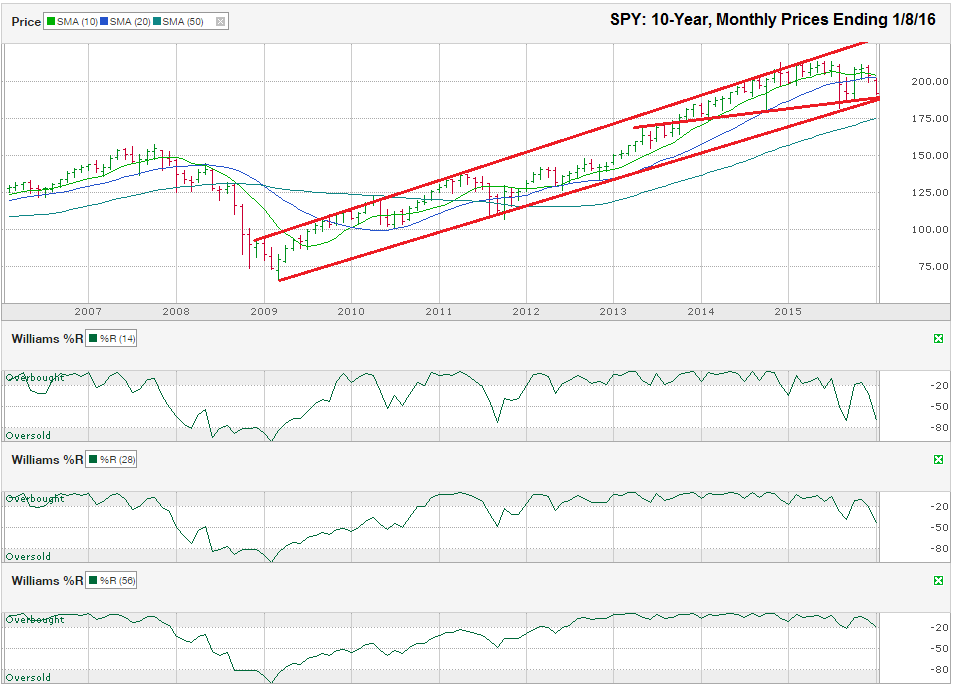
The chart below shows the monthly prices for the past 10 years on SPY, an S&P 500 Index ETF, after closing the week at $191.92 on January 8, 2016.
Stocks have been in a sustained bull market since bottoming in March 2009 and have traded within a broadening trading channel for this seven-year period. So far, each move to the trend line of higher lows has brought out calls that the end is near, but every drop has been a buying opportunity. Eventually this rubber band effect will end and the supportive trend line will break. Until this technical event hits the charts, traders will continue to profit from the dips with the risk of a collapse increasing at every test of the trend line.Traders have to broaden their time horizons when an index breaks through short-term technical support. The daily and weekly charts for SPY offer little guidance for where the ETF could find its next area of support, but a multi-year chart using monthly bars helps bring clarity in a volatile time.
The question always comes to, is this price drop the one that will break the trading channel or is it another buying opportunity? Rather than take an oversized risk, traders would be wise to wait and see. SPY finished the week within a $5 margin of error of the supportive seven-year trend line and a two-and-a-half-year trend line that is converging in January.
A short-lived drop below the trend line, as we saw in August 2015, would not signal the end of the rally, but a multi-day break in support could be the red flag preceding further declines that bears have been calling for. SPY was down 10.39% from its all-time highs at the lows of the day on Friday compared to the 14.67% drop SPY had in August 2015. A 10% decline is likely another healthy correction in an aging bull market, but until SPY can pull above its 10 and 20-month moving averages (close to $202), traders with a shorter-term focus should use caution before overloading on stocks. Those investors with a longer-term outlook should consider buying partial positions at the current 10% discount to last year’s all-time highs.
Beyond the trend lines, traders should watch the 10 and 20-month moving averages mentioned above for resistance and the 50-month moving average for support below the multi-year trend lines. If SPY breaks above $202 for more than three days, the stage would be set for more than $20 of upside. The 50-month moving average is 8.8% below Friday’s close and is slowly ascending. SPY will need more than geopolitical pressures to push it below this low point into bear market territory. Worst case, anyone buying into SPY at the $175 level would have limited downside risk beyond the next one to two years and a lot of upside potential. The Williams %R indicator fell below the -20 range on the 14 and 28-month indicators, but has held above this breaking point for the 56-month indicator. If Williams %R falls below -20 on the 56-month indicator for two months, a clear sell signal will be in place and even longer-term investors should consider cutting some losses before they lose even more money.


