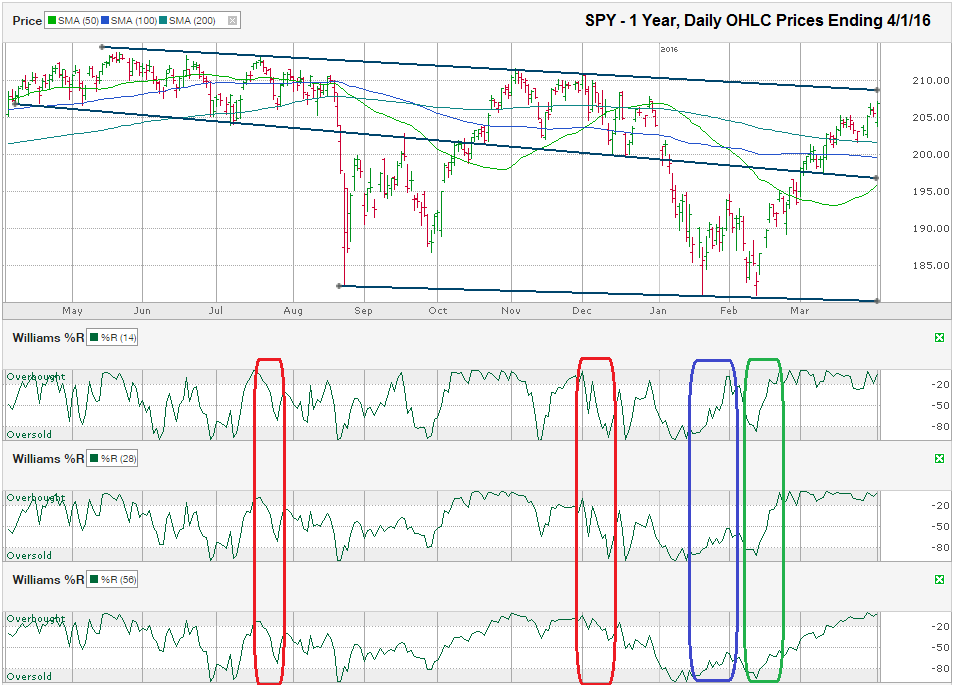
The chart below shows the monthly prices for the past year on SPY, an S&P 500 Index ETF, after closing the week at $206.92, on April 1, 2016.
Technical indicators can be cruel sometimes. As with every stock and index prediction tool, sometimes they give false positives. If they didn’t, everyone would use them and nobody would fall prey to a bear market. The occurrence of these false positives is the primary reason technical investors need to use more than one indicator. Three of my favorite technical indicators to use together are trend lines, moving averages, and Williams %R.
The Williams %R indicator, sometimes simply called %R, was early in its forecast for doom before the August 2015 correction. The steep decline hit stocks the following month before % R had a chance to reset for another red flag. The same indicator accurately predicted the return to the downside in December 2015, but gave a false positive for a lasting rebound in January 2016. The beauty of %R is that when it does give a false positive, the next signal tends to be very reliable, but not completely infallible. In mid-February, %R signaled another bullish turn and vigilant investors were rewarded. Since that day a month and a half ago, stocks have risen on a relatively steady basis and Williams %R hasn’t indicated the rally is near an end yet, but the chart shows another reason for caution.
The trend line of lower highs that began nearly 11 months ago, and marked the top of each rally since then, is within a few points of where SPY ended on Friday. A trend line this long shouldn’t be relied on to predict an exact turning point, but should be watched for a close range of where resistance to further strength might be met. The range to watch for SPY in the coming days and weeks is around $208-209, depending on how soon SPY takes its next step higher.
SPY is facing a high hurdle if it follows the typical path of an index after such a long and steady rally. In most instances when an index has had a run like SPY has, it hits resistance on its first contact with a long trend line. This resistance causes the index to pull back some and then retest the trend line after a short pause. The second test is more important. If resistance to higher prices continues, the index will be pushed back a few percent (if not more) most of the time. If the index breaks through the trend line on this second contact, it often comes back to test the same line as support before advancing quickly again.
The longest trend line in this chart shows a line that has been both support and resistance. It worked as great support until August 2015 and when it broke, SPY bottomed two days later. SPY recovered, but hit resistance on this same line and fell again. After multiple days of providing further resistance, the trend line broke and SPY pushed to multi-month highs, until it hit resistance at the same trend line of lower highs mentioned above. The same pattern repeated in December and January to the downside before SPY broke through to the upside again to begin March.
If SPY meets lasting resistance at the upper trend line, the likely reversal point for support could come from the 200-day moving average. The 200-day moving average is one of the most widely used technical indicators to help investors determine if bulls or bears are in charge. If SPY remains above the 200-day moving average, it has a much better chance of finally moving above the descending trend line of lower highs. If it falls below its 200-day moving average, the 100-day moving average and then the long trend line mentioned above, currently close to $196 (and its 50-day moving average), could provide support. If none of these potential areas of support hold, SPY could correct back to the lowest trend line since August 2015, currently around $180.
Other trend lines and moving averages are available on a shorter scale and could all come into play, but the multi-month trends tend to follow the longer duration indicators. Investors who are more concerned with the next few months versus the next few days should concentrate on the bigger picture and not fret over daily headlines meant to draw in viewers more than educate investors.


