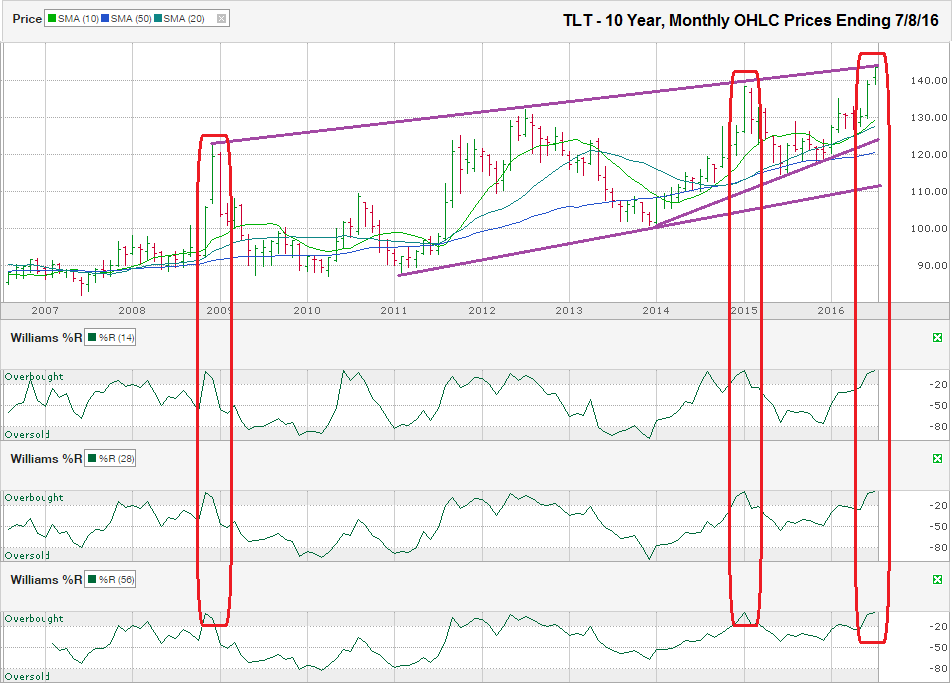
The chart below shows the monthly prices for the past 10 years on TLT, an ETF that tracks the US 20-year Treasury Index, after closing the week at $143.60, on July 8, 2016.
Technical indicators are not infallible, but are popular because they provide accurate guidance in most instances, especially when multiple indicators issue the same signals, as in the TLT chart. In this chart, the easiest indicators to use are the straight trend lines shown in purple. The upper trend line of higher highs shows where TLT has met resistance to further gains in each rally since the end of 2008. July marks the fourth attempt by the ETF to push above this trend line. The first touch of a trend line is only a starting point. The second touch is a hinge that guides the trend line for future resistance points. The third touch of a trend line is often a strong telling point where failure to break through resistance can quickly lead to a powerful reversal in price, as it did in early 2015 for TLT. The fourth touch point rarely breaks through resistance and is usually the last push to new highs before retesting the lower trend lines.
When the bull market in bonds ends, TLT will face little technical resistance as it moves towards the shortest of the three trend lines shown above. This short trend line of higher highs is currently around $124.00 and ascending more steeply than the other lines. This line has held support of the ETF since it began two and a half years ago and will give the price decline a reason to pause, if not completely stop. If TLT falls through this short trend line of higher lows, the next point of potential support will be at the trend line that started in early 2011. This medium length line has the starting point and hinge, but has not had its third touch yet. TLT should find strong support at this line when it returns to the lower area within this extended trading channel.
Moving averages are another popular technical indicator for traders. This chart shows the 10, 20, and 50-month moving averages for TLT. The gap between the 10-month moving average and the closing price on Friday mark the widest gap between the two since TLT last peaked 18 months ago. Along with showing general trends, moving averages help to show traders how far overbought an investment might be. A sudden and lengthy move in either direction is often met with a reversion to the mean and the stock or ETF moves closer to its moving averages fairly soon. TLT bulls will counter that the 10-month moving average recently moved above its 20-month moving average. This crossover is a bullish signal and should not be ignored, but due to the gap between the current price and the moving averages, the best gains are probably already logged. The moving averages (10-month at $129.57, 20-month at $127.69, and 50-month at $120.43) will meet the ETF somewhere between their current levels and the current price for TLT. Based on the wide gap, this meeting point should be somewhere in the low $130s, if not below $130, depending on how fast TLT’s price decline is.
Williams %R is less popular among traders because it is less straight forward, but I’ve found it to be one of the more reliable tools for forecasting price changes. Rather than look at one single time frame, Williams %R works best when three different periods are positioned together and all signal the same forecast. For TLT, the best combination is the 14, 28, and 56-month periods. In both instances (circled in red below) over the past 10 years when TLT reached extreme overbought levels (higher than -1.35 on each period), TLT has fallen sharply within two months. The current readings from Williams %R are higher than any other month in the past 120 readings (-0.07, -0.055, and 0.047 in ascending order). If history repeats, TLT should be much lower before Labor Day and possibly within the next couple of weeks.
Since this chart covers 10 years, traders should not expect an immediate return below the $120s, but rather an extended decline after the initial sharp drop when resistance holds against further highs. A one or two-day price drop does not necessarily mean the best days for TLT are over. Traders will need to focus on daily charts for a better guide of when to make their trades if looking to capitalize on the impending price decline.


