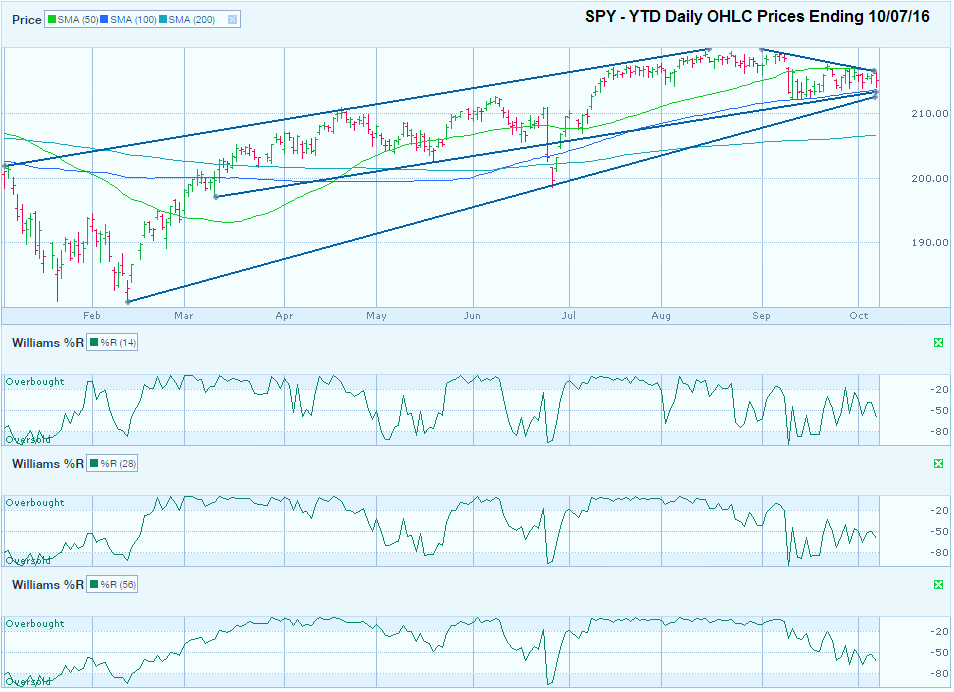
The chart below shows the daily prices for the year-to-date on SPY, an ETF that tracks the S&P 500 Index, after closing the week at $215.04, on October 7, 2016.
While the large intraday price swings seen recently make the markets seem out of control, stock indexes have been moving in a tight trading range. The SPY chart shows an index that is still in its long-term upward trend, but has been in a consolidation phase for more than three months. Set-ups that follow this pattern tend to break higher instead of retracing previous lows. Two important trend lines to watch for support are the lowest two that mark the trend of higher lows. These two lines are converging just below the intraday low for SPY seen on Friday. The longer trend line tracks the extreme lows since mid-February. The shorter trend line starts in the first half of March and skips the short-lived Brexit panic at the end of June.
The trend line that starts on the second trading day of January could come back into play if SPY comes out of its current consolidation phase and remains in its upward trading channel. At this point, this line of resistance seems out of reach for a market that is desperately searching for a catalyst to move higher. Before any move higher is considered worth buying, SPY needs to break above the shortest trend line shown in this chart. This short line marks the trend of lower highs from the beginning of September.
Of course, the trend lines are not our only guides. The moving averages confirm the areas of support and resistance marked by the trend lines. The 100-day moving average is currently at $213.62 and ascending and the 50-day moving average is at $216.71 and descending. As noted above, SPY is stuck in the middle at $215.04. As the trend lines and moving averages close in on each other, the index will push to one side and after a second confirmation day, traders will feel safe in buying into the momentum. Once the directional shift catches the follow-on trades, we’ll have a clear picture of where SPY should trade over the coming weeks.
If SPY breaks higher, the August high of $219.60 will be the first test. SPY only needs to push 2.12% higher to reach a new all-time high and surpass the August high and is likely to find resistance when it gets there, even if only temporarily. If SPY breaks lower, the 200-day moving average at $206.62 and ascending will be a key level to watch. Such a dip is only 3.91% below Friday’s close and 5.91% below the all-time high for SPY.
The Williams %R indicator echoes the weak momentum in stocks over the past month. In the 14, 28, and 56-day indicators, Williams %R gives no hint as to the upcoming directional shift out of the current doldrums. After predicting the slump that began in early September, Williams %R has stagnated, but is worth keeping an eye on after the next spike or dip to pinpoint a new exit or entry point. Remember, it’s not when the indicators enter the overbought of oversold ranges, but when they leave those areas that is the signal to trade.


