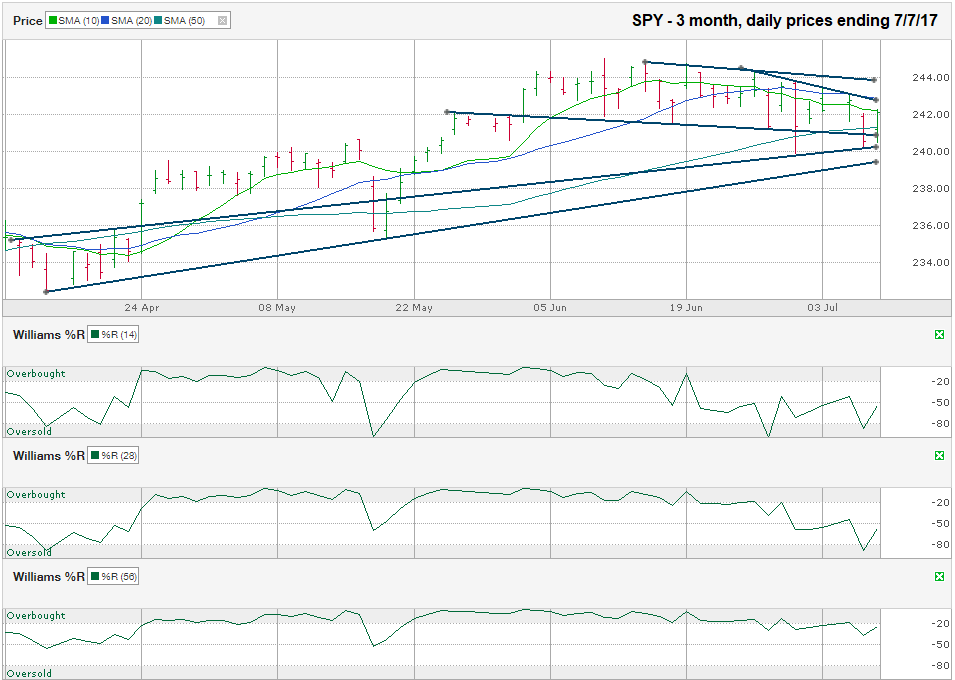
The chart below shows the daily prices for the past three months on SPY, the SPDR ETF that tracks the S&P 500 Index, after closing the week at $242.11, on July 7, 2017.
SPY retreated 2.0% from its intraday high of $245.01 set on June 9 before having a slight recovery and then dropping again. Even while setting a new high on June 9, the large-cap ETF started showing signs of weakness as it dipped below its 10-day moving average for the first time in weeks. Since then, it has had only one day when it has not crossed below the 10-day moving average intraday. On June 16, SPY traded below its 20-day moving average and has had one day since then without crossing below it. Weakness continued as the bearish crossover of the 10-day moving average fell below the 20-day moving average on June 27. SPY took two more days of trading before it fell below its 50-day moving average for the first time in a month and a half. Large-cap stocks rallied for a few days and then returned to the bearish side of the 50-day moving average again for the final two days of the week when SPY tried to rally, but hit resistance at its 10-day moving average.
Each cross below a moving average is a warning sign, even if it closes above the moving average by the end of trading. The trend lines show this same bearish view since early June as SPY has seen lower lows and lower highs. Using the full 3 months visible on this chart, I drew two ascending trend lines. The lower one marks the trend of higher lows and the longer one marks the trend line that began as resistance and became support. This longer line is where SPY found support on both the June 29 and July 6 lows. The two ascending trend lines will be key for technicians to watch in identifying a tipping point.
The Williams %R indicator tells a mixed story. The 14-day indicator signaled it was time to sell on June 16th, but the 28-day indicator didn’t echo that signal until June 30, just a few days after the 14-day indicator reversed its signal. The 56-day indicator has yet to turn bearish, but could in the coming days if it gets a confirmation (follow through) day of weakness. However, if Monday is a positive day for the S&P 500, both the 14 and 28-day indicators will turn bullish again.
The moving averages are the only consistent technical indicator in this chart. The trend lines and Williams %R need more time to increase the probability of their accuracy. The next few days of trading after the low-volume holiday week will give strong guidance for where we could see the next 2-5% move for the broad market.


