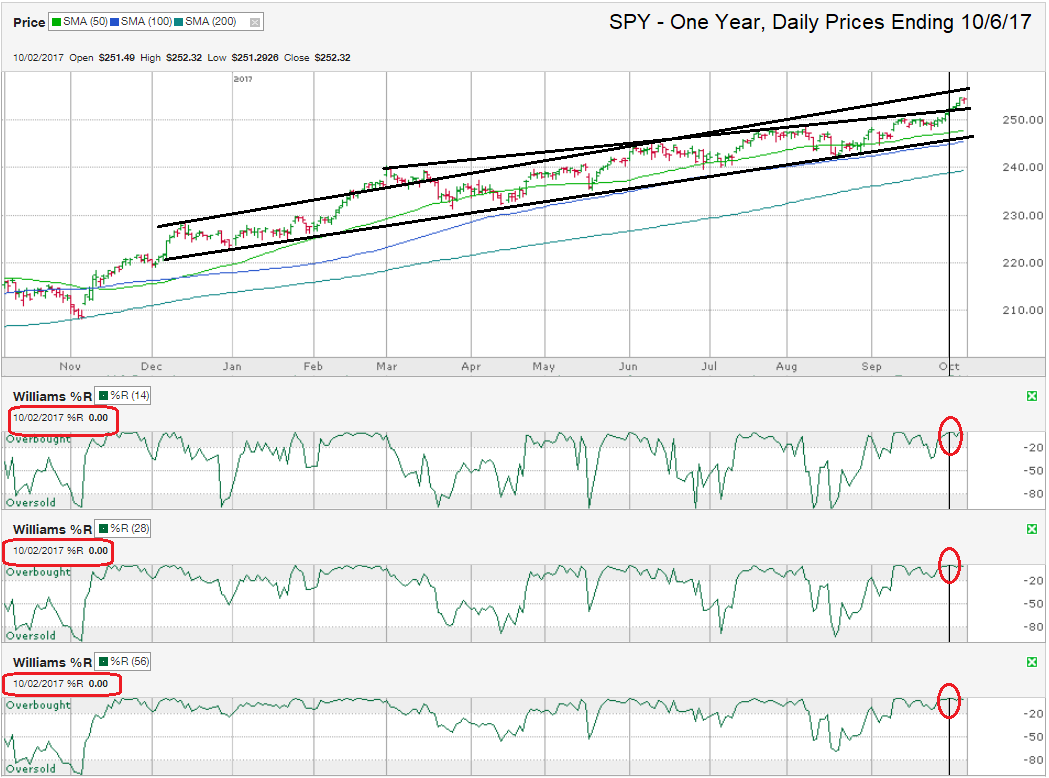
The chart below shows the daily prices for the past year on SPY, the SPDR ETF that tracks the S&P 500 Index, after closing the week at $254.37, on October 6, 2017.
SPY has had an incredibly boring and strong 12 months, recording one of the lowest periods of volatility in the history of the S&P 500. Two technical indicators are predicting the large cap ETF is due to take a breather. Before I sound too much like an alarmist, a “breather” is much different than calling for the beginning of a bear market or even a full 10% correction. While SPY could fall into a correction or worse, it’s too early to tell and the fundamentals don’t appear to be ready to trigger a bear market.
The first technical indicator is more subjective than the second one. I drew the trend lines of higher highs and higher lows in black lines on this chart. The lower trend line has provided support to every dip since December without one exception. For now, we don’t have a reason to believe that trend will end soon. However, SPY is getting closer to the longer trend line of higher highs and if history repeats, it should find resistance and move lower again to test the lower trend line. The shorter trend line of higher highs acted as resistance to further gains from March until this past Tuesday. This shorter line could become a new line of support as the S&P 500 continues higher in its narrow trading range. This theory would hold more water if it wasn’t for the Williams %R indicator.
On Monday, October 2, the Williams %R, a non-subjective technical indicator, reached the 0.00 overbought level (circled in red on the chart) in its 14, 28, and 56-day views. This extreme overbought condition is an extremely rare and hasn’t happened since January 25, a few days before SPY paused its run higher and retested the trend line of higher lows. After such an extreme reading on all three periods, an index (or stock) typically retreats two to three days later. The retreat for SPY should’ve hit on Thursday to match historic patterns, but didn’t have a negative day until Friday when it only declined 0.11%.
Since no technical indicator is 100% accurate, SPY could fail to drop, but probability and history are on the side of the technical indicators. If the lower trend line of higher highs and the 100-day moving average, which hasn’t broken support since November 2016, provide support again, SPY shouldn’t fall further than 245.00, or 3.6% below Thursday’s high. A 3.6% decline happens multiple times throughout most years (as does a 10% decline), but has only happened one other time in 2017. In a year without volatility, a 3.6% decline could be all SPY needs to recharge before pushing into new highs again.


