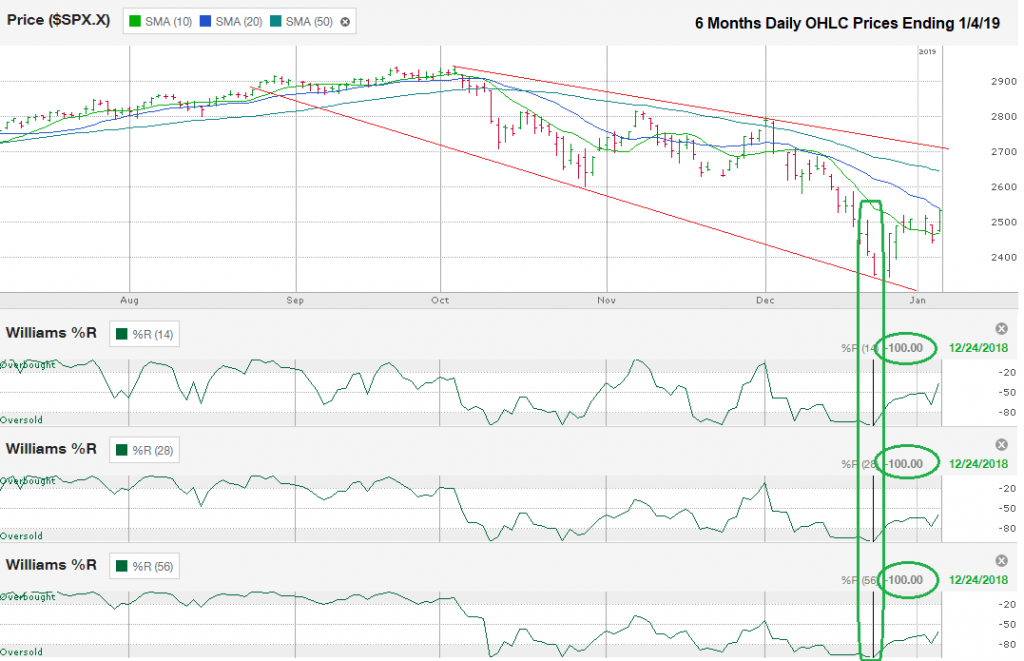
The chart below shows the daily prices for the past six months for the S&P 500 index, aka SPX, after closing the week at 2,531.94 on January 4, 2019.
The S&P 500 fell 20.2% from its intraday high of 2,940.91 on September 21 to its intraday low of 2,346.58 on December 26. The technical definition of a bear market is a 20% drop from high to low. Some technical analysts use closing highs and lows, but most of us use intraday prices. The fine line doesn’t matter as much to the individual retail investor except to know that some computer algorithms are set up to sell until an index reaches the 20% threshold and buying can resume after the index moves above the 20% demarcation line.
So far, this technical benchmark has worked in turning the market’s trend and the Williams %R technical indicator supports the idea that a near-term bottom is in for stocks. I circled the points on the Williams %R indicator where it reached a maximum reading of 100%. In most cases, when a stock or index shows a 100% reading on each of the 14, 28, and 56-day periods, it indicates a reversal of the trend will occur within the following one or two days. The SPX hit this point on December 24 and bottomed the following trading day on December 26. While reaching the 100% reading is key, the absolute buy signal comes when Williams %R moves out of the oversold range, which indicates the worst of the selling is over and sentiment has changed. All three of these periods showed a clear break above oversold on December 27. An index can retest its previous low after rebounding and if it doesn’t fall below the previous low, a “double bottom” is in place and stocks will have a green light to move higher. If the test of the previous low does not hold support, the index is likely going to push lower and follow the trend line of lower lows that it hit again on December 24. Any bounce off of this lower trend line could be a buying opportunity, but the probability of a rally to last increases when Williams %R agrees with the momentum shift.
The SPX traded below its 10-day moving average from December 4 until December 28. The move above the 10-day moving average in late December is another bullish signal. After a massive rally on Friday, the SPX hit resistance at its 20-day moving average, but after an 83-point (3.4%) gain on the day, it can be excused for not pushing further into the green. The 20-day moving average has acted as resistance in the past and will be important to watch in the coming days. If the SPX can move above its 20-day moving average, currently at 2,538, it does not have another technical barrier to face until its 50-day moving average, currently at 2,645.
After the large cap index breaks above its 50-day moving average, the trend line of lower highs that began on October 3 and was touched again on December 3 will come into play. The descending line is slightly above 2,700 now, but it could be closer to 2,675 or even 2,650 by the time the SPX climbs that high. This trend line marks the top of the trading channel for the index and will be close to a 50% retracement of the past few months’ price decline. Traders will pay close attention to this point of the chart and should expect the rally to pause and possibly dip two to three percent before regaining support enough to push through. Either way, this will be a point to reassess the technicals for further forecasts.


