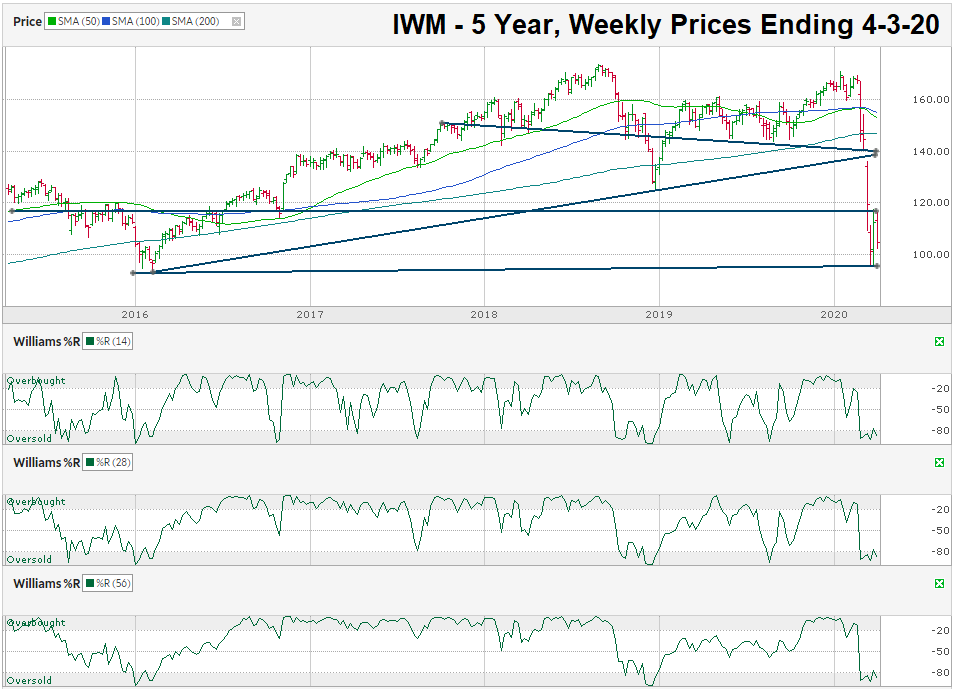
The chart below shows the weekly prices for IWM, an ETF that tracks the Russell 2000 small-cap index, after closing the week at $104.62 on April 3, 2020.
Most charts have an easily recognizable pattern when I look at them. Due to the recent carnage in the markets, I had to zoom out to a five-year view to find any hints of what just happened and what could be on the horizon. Even on a five-year, weekly prices basis, some indicators do not help much still.
The moving averages are so far away from current prices that they have become irrelevant, other than to show how much we’ve seen prices fall. In most cases, when an index or individual stock is 20% above or below its 200-week moving average, we have reason to expect a change in the pattern soon. IWM is trading nearly 30% below its 200-week moving average. While this distance doesn’t give chart technicians a nearby target to pick, it is likely the rubber band effect will narrow the gap in the coming weeks and months.
The Williams %R indicator hasn’t shown oversold conditions that were as pronounced as the brief drop in December 2018. Without a reading closer to -99, we need to wait until the small-cap ETF’s indicator moves out of the oversold area for at least three days. One or two days above the oversold area could be an anomaly while an extra confirmation day can point to a lasting recovery. This signal delay will cause traders to miss timing the absolute bottom, but will also prevent buying before the final bottom is recorded.
The trend lines offer the best guidance for now. The week of March 9 gapped lower at the open which pulled IWM below its trend line of higher lows that began in February 2016. In the same week, IWM lost support of its trend line of lower lows that began more than two years ago. The result was a massive sell-off by the algorithms that produce the vast majority of trades.
IWM found support slightly above the floor established over four years ago. The bounce from the lows pulled IWM more than 20% higher to reestablish a wide area of resistance and support last seen in 2015-2016. The key point to watch for an upside breakout is this long trend line that is currently at $117.60, the intraday high from March 26. After breaking above $117.60, the small-cap index could rally another 15% before it meets the trend line of lower lows mentioned above.
To the downside, the key point of support is the March 19 intraday low of $95.69. This is more likely to hold on a retest as the outlook begins to improve for businesses to open up again in the coming months. Each week we get closer to an answer of when the virus’ curve will flatten and that expectation should provide stocks with a floor. If the virus’ curve worsens more than expected and stocks cannot hold onto the previous low, we could see IWM move as low as $75 before finding support from its 2012 lows.
The charts do not say to buy or sell right now. They say wait for the indicators to change and be ready to react when they do. At the same time, for longer-term investors, the idea of buying IWM below $105 when it was over $170 less than three months ago and should return to $135-140 within a year (if not much sooner) is very tempting and likely a good buy now, given enough time to recover and the stomach to accept further losses in the short-term if the headlines get worse.

