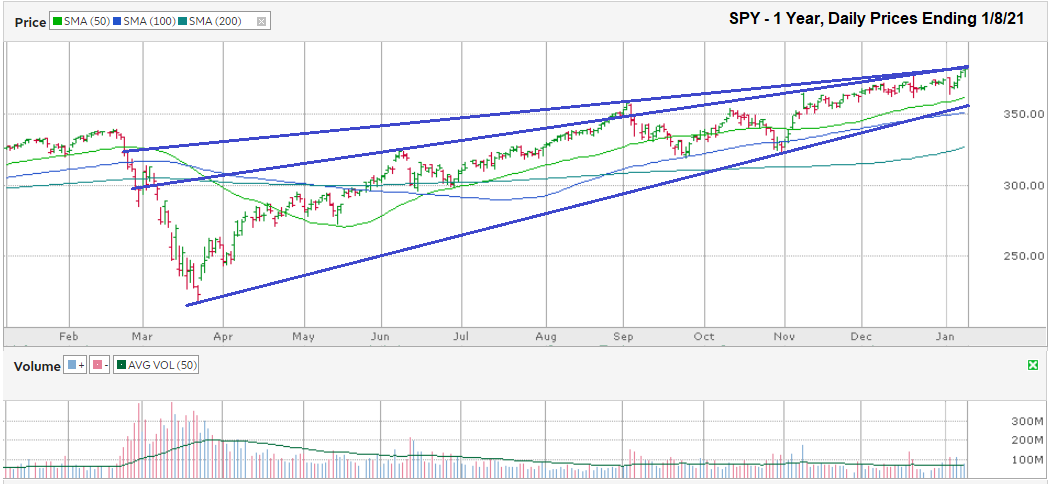
The chart below shows the daily prices for the past year through January 8, 2021, for SPY, a large S&P 500 tracking ETF, after closing the week at $381.29.
SPY is moving through an ascending wedge pattern, which means that after falling from an earlier high, the recovering pattern shows a tightening wedge shape. In other words, both trend lines are rising, but the lower trend line has a steeper trajectory. SPY’s trend line of higher lows is moving towards a point of convergence with its trend line of higher highs.
Identifying ascending wedges can be tricky, but this SPY chart shows it clearly. Even when I include two different possible trend lines of higher highs, the ascending wedge remains obvious. To confirm the pattern, volume needs to show a declining trend from the widest part of the wedge at the beginning towards the point of convergence. The SPY chart confirms this drop in trading volume. Also, the lower trend line needs at least two touch points coupled with at least three touch points on the upper trend. The reverse works too. The touch points on the upper trend line have become more frequent over the past two months, which indicates resistance to higher prices continues to be in place. The two touch points on the lower trend line are clear, but do not create a certainty that a collapse is imminent. SPY could retest the lower trend line and recover to new highs before breaking through support to the downside weeks later.
The good news is that SPY has had a fantastic run from its lows, but the bad news is an ascending wedge pattern is a bearish indicator, meaning a trend reversal is likely before the lines converge. While no technical indicator is infallible, the ascending wedge pattern is more reliable than most, especially the longer it lasts. Investors need to keep an eye on the trend line of higher lows to watch for weakness in the large-cap index. SPY could bounce off of its trend line of higher lows and push to new highs again, but the advantage left to gain by waiting is diminishing. Eventually, the SPY’s upward trend will falter and at this point the ETF seems more likely to fall 10% before it adds another 10%.
SPY’s 50 and 100-day moving averages are close enough to the trend line of higher lows that they could help with support in the near-term, but once they break support along with this trend line, the next area of support might not be until the 200-day moving average. The 200-day moving average is over 14% below Friday’s closing price and should provide ample support after the S&P 500 has shaken out most of its near-term froth. Assuming COVID counts are waning by the time SPY falls 10-14%, the market should recover quickly.


