I’m posting multiple Dow Jones charts (aka $DJI, DJIA, the Dow) today. I’m starting with the one day chart, then the one week, followed by the one month and then I jump out to the 10 year chart. I chose these because each chart’s story is interesting to me. I worked from home on Friday and although I was loosing my shirt on the market, I couldn’t help be realize that the history of this past week and month are fascinating. We’ll be telling our kids and grandkids about being actively invested during this mess and trying to pass on our wisdom so they don’t repeat our mistakes in 80 years from now.
I recommend picking up Barron’s October 13, 2008 edition. I have it delivered and have pulled out some interesting notes. An article entitled Closer to the Bottom listed some stats that could help you relax. The average bear market since 1940 has lasted 10 months. If you think this is an average time, we’re looking good soon. If you think this is extraordinary (as I do) we have a little longer to wait. This 40% drop we’ve had is more than the average bear market slide of 30% since 1940. Michael Santoli pointed out The S&P 500’s market cap is now a small percentage of US GDP than it was at the 2002 bear-market bottom. Take this with a grain of salt since most people think the GDP is slowing. That means the percentage might revert to the norm from the GDP’s side rather than from the market cap’s side.
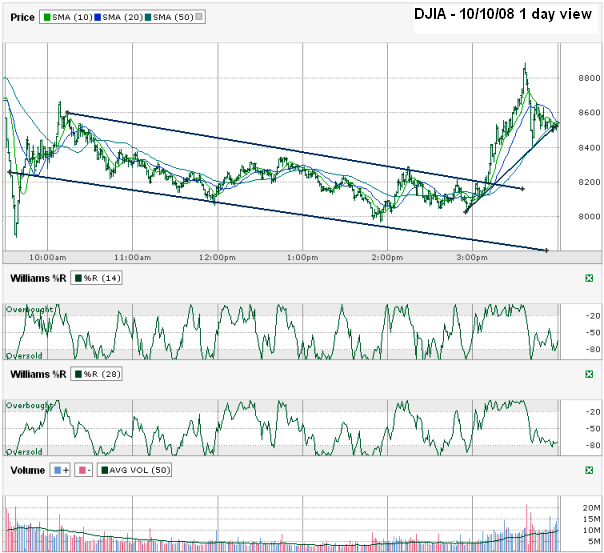
You know it’s a crazy market when the Dow is down 128 and you’re happy. That’s how this first chart made me feel. I watched the first five minutes on CNBC to see the horror in everyone’s face and voice. Within a few minutes we were off the bottom and the DJIA was making a comeback. It touched positive and traders actually cheered as if they were at a college football game. It showed how emotion was working this market. Once it broke the downtrend for the day around 3:05 pm, the Dow took off.
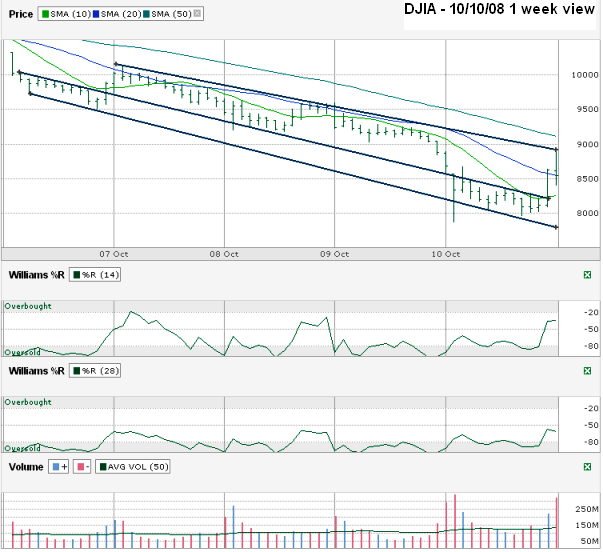
The one week chart shows that Friday’s rally didn’t break the week’s downtrend. That’s not a good sign for Monday’s open, unless the emotional comeback can be enough to overcome the short term downtrend. I’d like to think it can, but that doesn’t mean I’m buying at the open by any means.
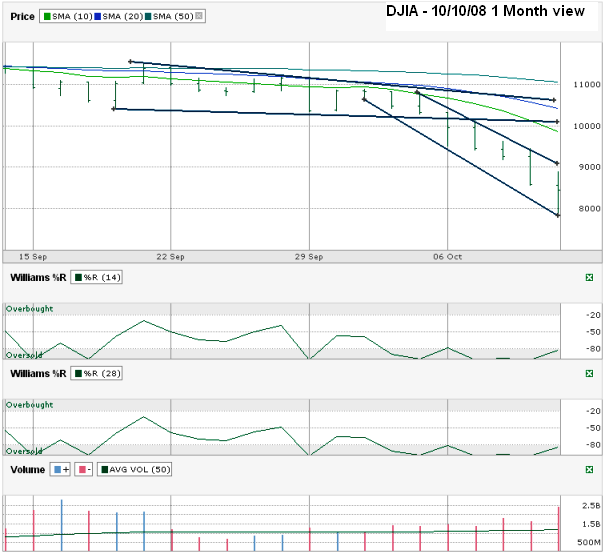
The one month chart shows that IF we can break the six day down trending trading channel, the longer trend lines around 10,000 and 10,500 will be tough lines to cross. I could see us getting up to $10,000 and then coming back to retest the lows of Friday morning. I won’t start getting confident until the 7,500+ range holds again. We have not broken Williams %R oversold yet on this chart or the next either. Keep that in mind for a longer term perspective
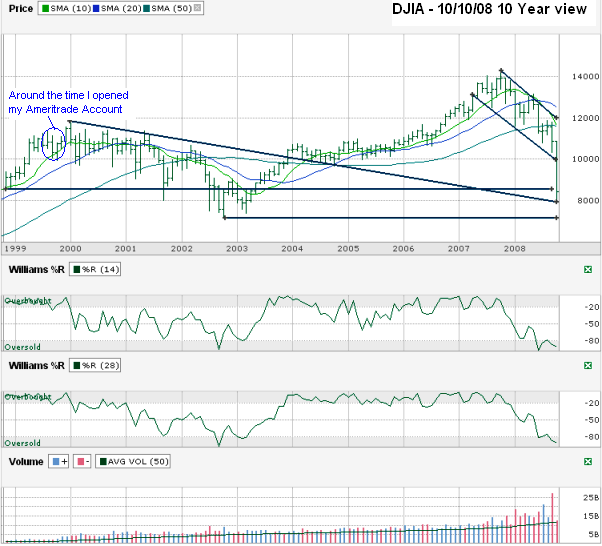
The 10 year chart includes where I started trading more actively which was in late 1999 and the Dow was higher than it is now. I could have done better if I had put our money in CDs the entire time. I’ve put some money in CDs, but dare not think how much more money we could have if I had not invested any of it in stocks. The flip side is that we still have some money in our account and when this bear passes, I will have learned many lessons on how not to lose so much again and possibly even make money in the next ugly market.


Interesting Stuff. I was under the impression the average bears market lasted 18 months. But it doesn’t really matter too much. Good luck!
It all depends on which article you read along with the starting date.
– http://www.fool.com/dripport/2002/dripport020725.htm says 10 months.
– http://www.usnews.com/articles/business/economy/2008/01/22/is-a-bear-market-next.html – says 1.3 years since 1926.
Notice the starting date in my note was 1940 but the USNews article was 1926.
I don’t think that “the percentage might revert to the norm from the GDP’s side rather than from the market cap’s side” since GDP is only likely to drop fractionally in a recession. Even in a severe recession GDP only contracts a few % over a year or two – not enough to significantly boost the ratio of market cap to GDP.
Assuming you are correct, we might be very close to the market bottom now. I have no argument against that from a fundamental view. From a technical view, I still want to see a retest of the lows.
I think it is possible and even good if stock are going trade sideways-down for few years. These artificially inflated valuations are not good for the economy, unless if you don’t care about the next generation.
I’d love a sideways market for a few years. It’ll help shake out the “investors” looking for easy money and will allow me to sell puts without missing out on big upside gains.