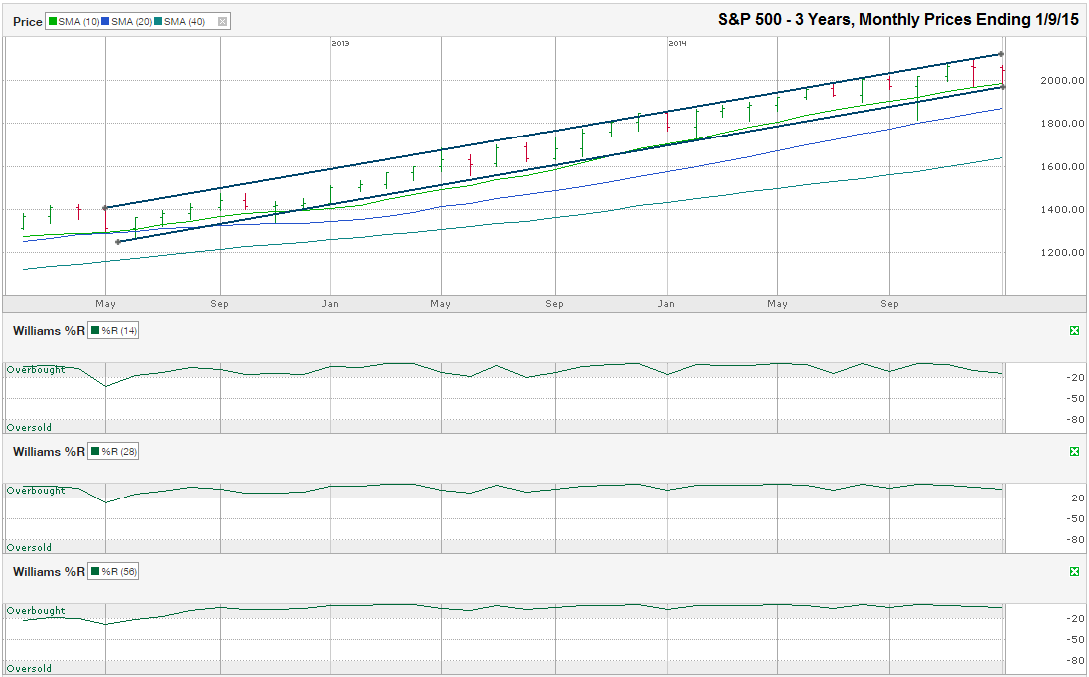
The chart below shows the monthly prices for the past three years on the S&P 500 Index ($SPX) after the index closed the week at 2,044.81 on January 9, 2015.
At the beginning of December, the S&P 500 ended a multi-week move higher that included very narrow intraday price swings. Since those days of 10-point swings, the SPX has had a series of 30 and 40-point swings intraday. Days with wide margins between its highs and lows can feel worse than they really are. Traders who initially fear losing money, quickly switch their fear to the risk of missing gains when the index reverses a few days later. What is more important is that the large-cap index has not left its three-year trading channel since October.When stocks hit a volatile period and fear starts to consume investors, charting a multi-year view of the major indexes is a great way to clear away some of the daily noise and put the recent price action into a more constructive view. The daily price movements of stocks shouldn’t be the focus for long-term investors. Longer trends are more helpful for those who do not plan to trade in and out of the market on a regular basis. At the same time, short-term investors can find insight that can benefit their immediate needs too.
For the past three years, the SPX, with only two exceptions, has maintained a steady move higher with clearly defined trend lines of higher highs and higher lows. Even in the two months when the SPX fell below its lower trend line in the middle of the month, it finished the month close to its monthly high and resumed its trend that runs along with its 10-month moving average as added support.
On January 6, the S&P 500 found support from its trend line of higher lows and 10-month moving average. These are going to be the first indicators to watch to the downside to see if the bears might have their turn to take the reins again. The 10-month moving average is still ascending at 1,986.34 and the trend line of higher lows is only a few points below it. Traders won’t know if any break below the 10-month moving average is the beginning of a bear market right away. While it would raise yellow flags, a break below the 20-month moving average (1869.75) would send up red flags. The SPX has remained above its 20-month moving average since June 2012 and has been solid support on both breaks below the 10-month moving average.
The S&P 500 hasn’t had a true correction (defined as falling at least 10%) in more than a year. Stretches this long are rare and it has traders worried that the market is due for such a reset. If the S&P falls to its 20-month moving average before the end of February, it could register this overdue correction and bring the bulls back into a buying frenzy with a renewed optimism.
The Williams %R indicator has not had a two-month period below its overbought range in more than 3 years and has still not shown a reason for bulls to worry. This indicator does not give early warnings when viewed on a monthly breakdown, but can be very helpful trying to predict when the next full bear market has begun. Until Williams %R and the 20-day moving average alert investors to longer-term concerns, investors need not worry about the daily gyrations of a moody market. Short-term traders can work the swings between the trend lines to try to eke out an advantage, but should be careful until they’ve seen a successful retest of the recent lows.


