
The June 25th issue of Barron’s had a follow-up article on DJO that made me take a closer look. In short, the writer was bullish with his belief that DJO is in a recession proof business. Being in a so called recession proof business doesn’t mean the company itself is incapable of taking a hit. DJO has already taken a hit earlier this year and has been on a rapid comeback.
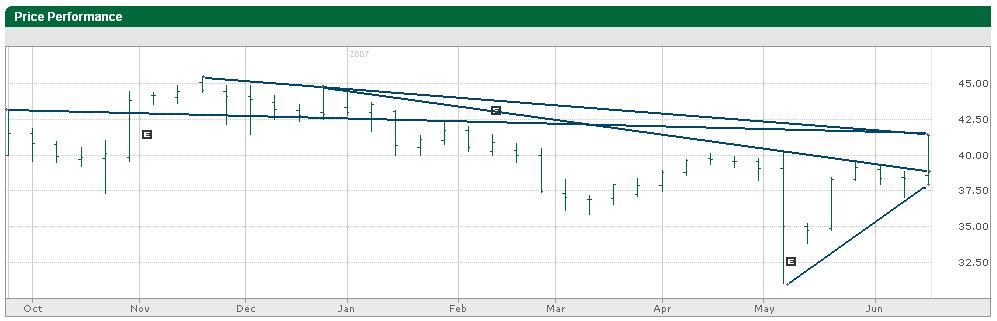
Check out the DJO weekly chart attached at the bottom of this post. This week will be a crucial week in predicting the near-term future for DJO’s stock price. I’ve drawn two lines that come together right at the closing price on Friday. One of those lines is the downward trending line starting in November 2006 and the other is a (random?) line that hits off a couple of highs going back to September 2006 to Friday’s close. Another line shows where DJO broke through the steeper downward sloping line from December 2006. That’s a big bullish sign for me along with the fourth line I drew from just over a month ago that is covering the higher lows DJO has being experiencing.
I’m banking on that final line as being the near term bottom for DJO as it continues to rise. I entered a limit order for two August naked puts on DJO this morning to see if I can catch some of this ride that could be fun.
This move will also give me some exposure to the Healthcare industry and further diversify me as I’m currently a little over exposed to Basic Materials. DJO’s trailing p/e is quite high at 92.07, but has a brighter future with a forward p/e of 20.77 and a (not quite ideal) PEG of 1.82. Schaeffersresearch.com rates DJO 4 out of 10. Being under 5 typically removes a stock from a potential trade for me, but I’m breaking my rule on this one. We’ll see if it bites me in the end. Also potentially troubling, the CEO sold 10,000 shares on Friday. Maybe he needed a new boat or maybe he is thinking it’s a top. One doesn’t know.
Technorati Tags: naked puts, investing, stocks, options, covered calls, options strategies, trade, stock chart, DJO
After watching DJO bounce around some this morning I lowered my limit to 1.80. While DJO was trading at 41.33 at 12:39, my lowered limit hit and I received $348.50 for selling two DJO August 40 puts (DJOTH).