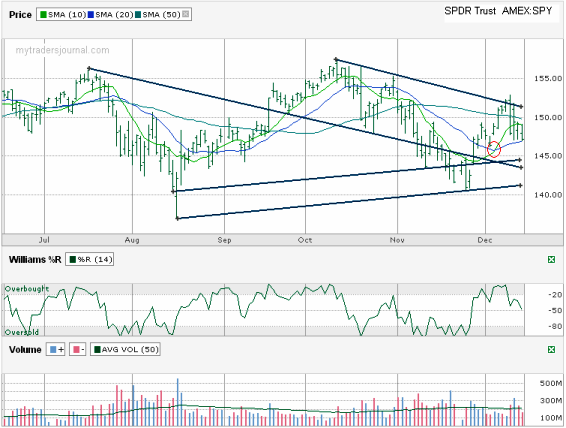
I haven’t charted the S&P 500 in a while, but instead of just charting the $INX this time I decided to chart its biggest ETF, the SPDR Trust, aka SPY. At a quick glance you can see that my neutral sentiment rating I wrote about on Thursday has a chart to back it.
The longer trading channel I’ve drawn is clearly aiming south east, but I also drew two potential upward trending support lines that are not too far off. I can easily see a sideways period of SPY for a few weeks at least. I see a couple of bullish indicators on this chart. The first one that jumped out was the bullish crossover I circled in red of the 10 day moving average moving above the 20 day. That day confirmed a good run was still in the works for SPY. The 10 and 50 day moving averages might only be a few days away from another bullish cross over unless the current support that’s holding on the 20 day moving average breaks. For three days that 20 day moving average has been strong enough not to break, even intraday. At the same time, the 10 day moving average started to act as a ceiling.
To add to my neutral feelings, the lower indicators I included, Williams %R and Volume, don’t add too much to the equation. %R shows neither overbought nor oversold. Volume compared to its moving average shows mainly light trading days recently, but when it breaks on higher volume it’s anyone’s guess if the bulls or bears will take control. Some of that same belief is seen in the VIX and VXN numbers lately. As volatile as the market has felt lately, the VIX and VXN at 23.27 and 25.91 respectfully are nowhere near their highs of the summer.