
Even a novice could chart the recent Dow Jones Industrial Average (aka DJIA and $INDU) to see that support has been broken. The chart below is a five year monthly view. The first big warning of the shift to a bear market came in November when the DJIA broke the 10 month moving average. It recovered briefly only to close the month below it again. A confirmed close below the moving average is bad news most of the time and this time proved to hold true again with the collapse we’ve felt over the past couple of weeks.
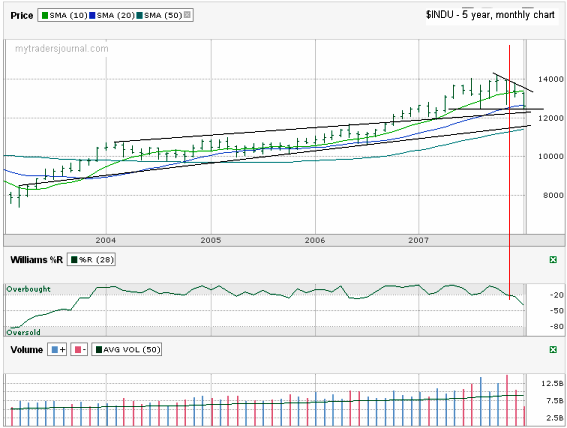
Volume has been up the past two months which have been down months for the DJIA. This is another clear bearish signal. This month, only half-way over, is destined to have higher volume still.
The other dead give away, as if we needed another, seen by charting a monthly view is the Williams %R break that happened in November 2007 from the overbought territory. I mentioned a few weeks ago that when using %R it’s important to watch when the line breaks out of an overbought/oversold area and that’s when the changes occur. This red line above shows a perfect example.
With three of these indicators looking flat out ugly, I can only think the bad is not over for the broader markets and plan to play it cautiously with my bullishtrades in the near-term and will likely strongly consider selling more naked calls to balance out the naked puts I’ve already sold or am thinking of selling in the near future.
If you think others would enjoy reading this article, please click the “Stumble It!” button below.