
I’m charting the Dow ($INDU) again today. I read an interesting article in Barron’s this weekend that highlighted the longer trend of the overall stock market. The short version is that we overbought with such great disregard for the norm that we were due for a good pull back to rejoin the longer term trend. The theory is that the markets (I’ll use the Dow as an example for the rest of this piece) are still ringing out the excesses of a few years ago, so we were really due for a longer sideways market, if not a harsh down turn. We’ve had a mix.
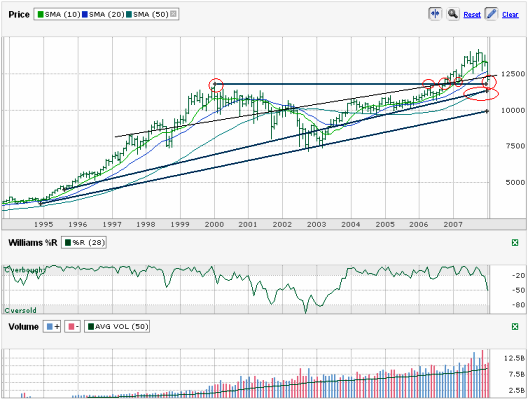
I went back 20 years to chart the Dow and the trend was so off starting around 1995 that I shrunk the chart up a few years and settled on what you see above. What I see is a worst case possible crumbling down around 10,000, which I don’t think is likely. The more likely trend the $INDU will latch onto is the one above that. It comes close to coinciding with the 50 month moving average and isn’t far from the next line up. That next line is the horizontal line starting at the highs of 1999/2000 and then the first high of 2006 and then the higher low of 2006 on through the lows of 2007.
Without taking into account the different circumstances brought on by the housing/financial collapse that would be a good line to stick with. Most are saying a recession stands about a 50/50 chance of happening. Depending on which side of that 50 you fall can give you a possible idea of how deep we’ll go. I have a slight feeling of (stupidity) optimism that makes me think we’re due to flatten again fairly soon and HOPE we don’t rocket back up so we all have time to get back aboard and work our options a little smarter.