
I’m back to charting the Dow Jones (aka “DJIA” or symbol “$DJI”) today. It finally broke above 13,000 and even stayed above it on Friday. That put the DJIA above the line of resistance at 13k and since I last charted the DJIA, it broke the lower resistance around 12,700. You can see a new upward channel that has formed starting with the low of January as the beginning of the trend line of higher highs. It has also stayed above the 10, 20 and 50 day moving averages for a couple of weeks.
Due to this break above 12,700, I’m changing my sentiment to slightly bullish on my home page. I went Bearish in January when the DJIA was at 12,500 and should have changed it two weeks ago. At least I’m awake at the wheel again now.
I opted for slightly bullish versus just flat out a raging bull because I see potential for some factors that could weigh us down still. If the DJIA can get down to that lower trend line of higher lows, I’ll be ready to jump in more than I have already. As of this weekend I’ve sold enough naked puts combined with my long positions covered with calls to equal 102% of my account value. I have a lot of options expiring in May, so I’m in a position to sell new puts on any stock I like for the foreseeable future. It all comes down to finding those stocks which hasn’t been as easy as I’d like if we are truly starting a new bull run now. That’s another reason for my caution.
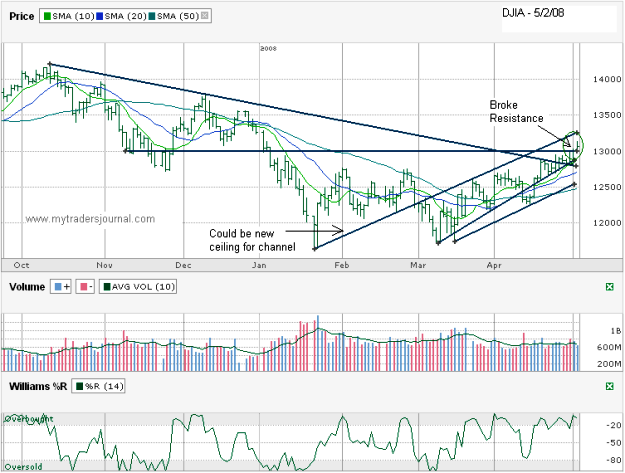
I don’t see resistance at 13k, but I see a strong resistance line (which is now a support line) at about 12,700.
13k was the previous low a couple of times and then acted as a ceiling more than a week ago again. I agree 12,700 could be support now, especially when the upward trend of higher lows meets it along the way. That could actually be right where the downward trendline line was aiming from previous highs last fall. I didn’t mention it, but I would expect that line to be support also.
I remember when last year started going bearish, nobody could believe it for awhile. Now that things start looking bullish, how long before we believe? Of course, anything’s possible. So 15000 or 11000 are both possible. Man, i need a crystal ball. Nah, really, if i believe the trader almanac from the library, years ending in 8’s are good on average, and we should go up the rest of this year. Gosh, i just want to start daytrading and reporting my percentages here real soon. Anyway, another excellent chart, thank you